🎉 Clootrack recognized by OpenAI for crossing 100 billion tokens in Voice of the Customer analytics →
Read the story


Roughly 1 in 8 U.S. adults report current or recent GLP-1 use, according to 2025 surveys from KFF and RAND Corporation. J.P. Morgan projects approximately 25 million Americans on treatment by 2030, up from around 10 million in 2025, and oral formulations launching in 2026 are expected to accelerate penetration further.
Why this matters for retail: At this level of penetration, GLP-1 is not a customer segment. It is a behavioral layer embedded across the existing customer base, overlapping directly with core grocery, apparel, beauty, fitness, and mass retail shoppers.
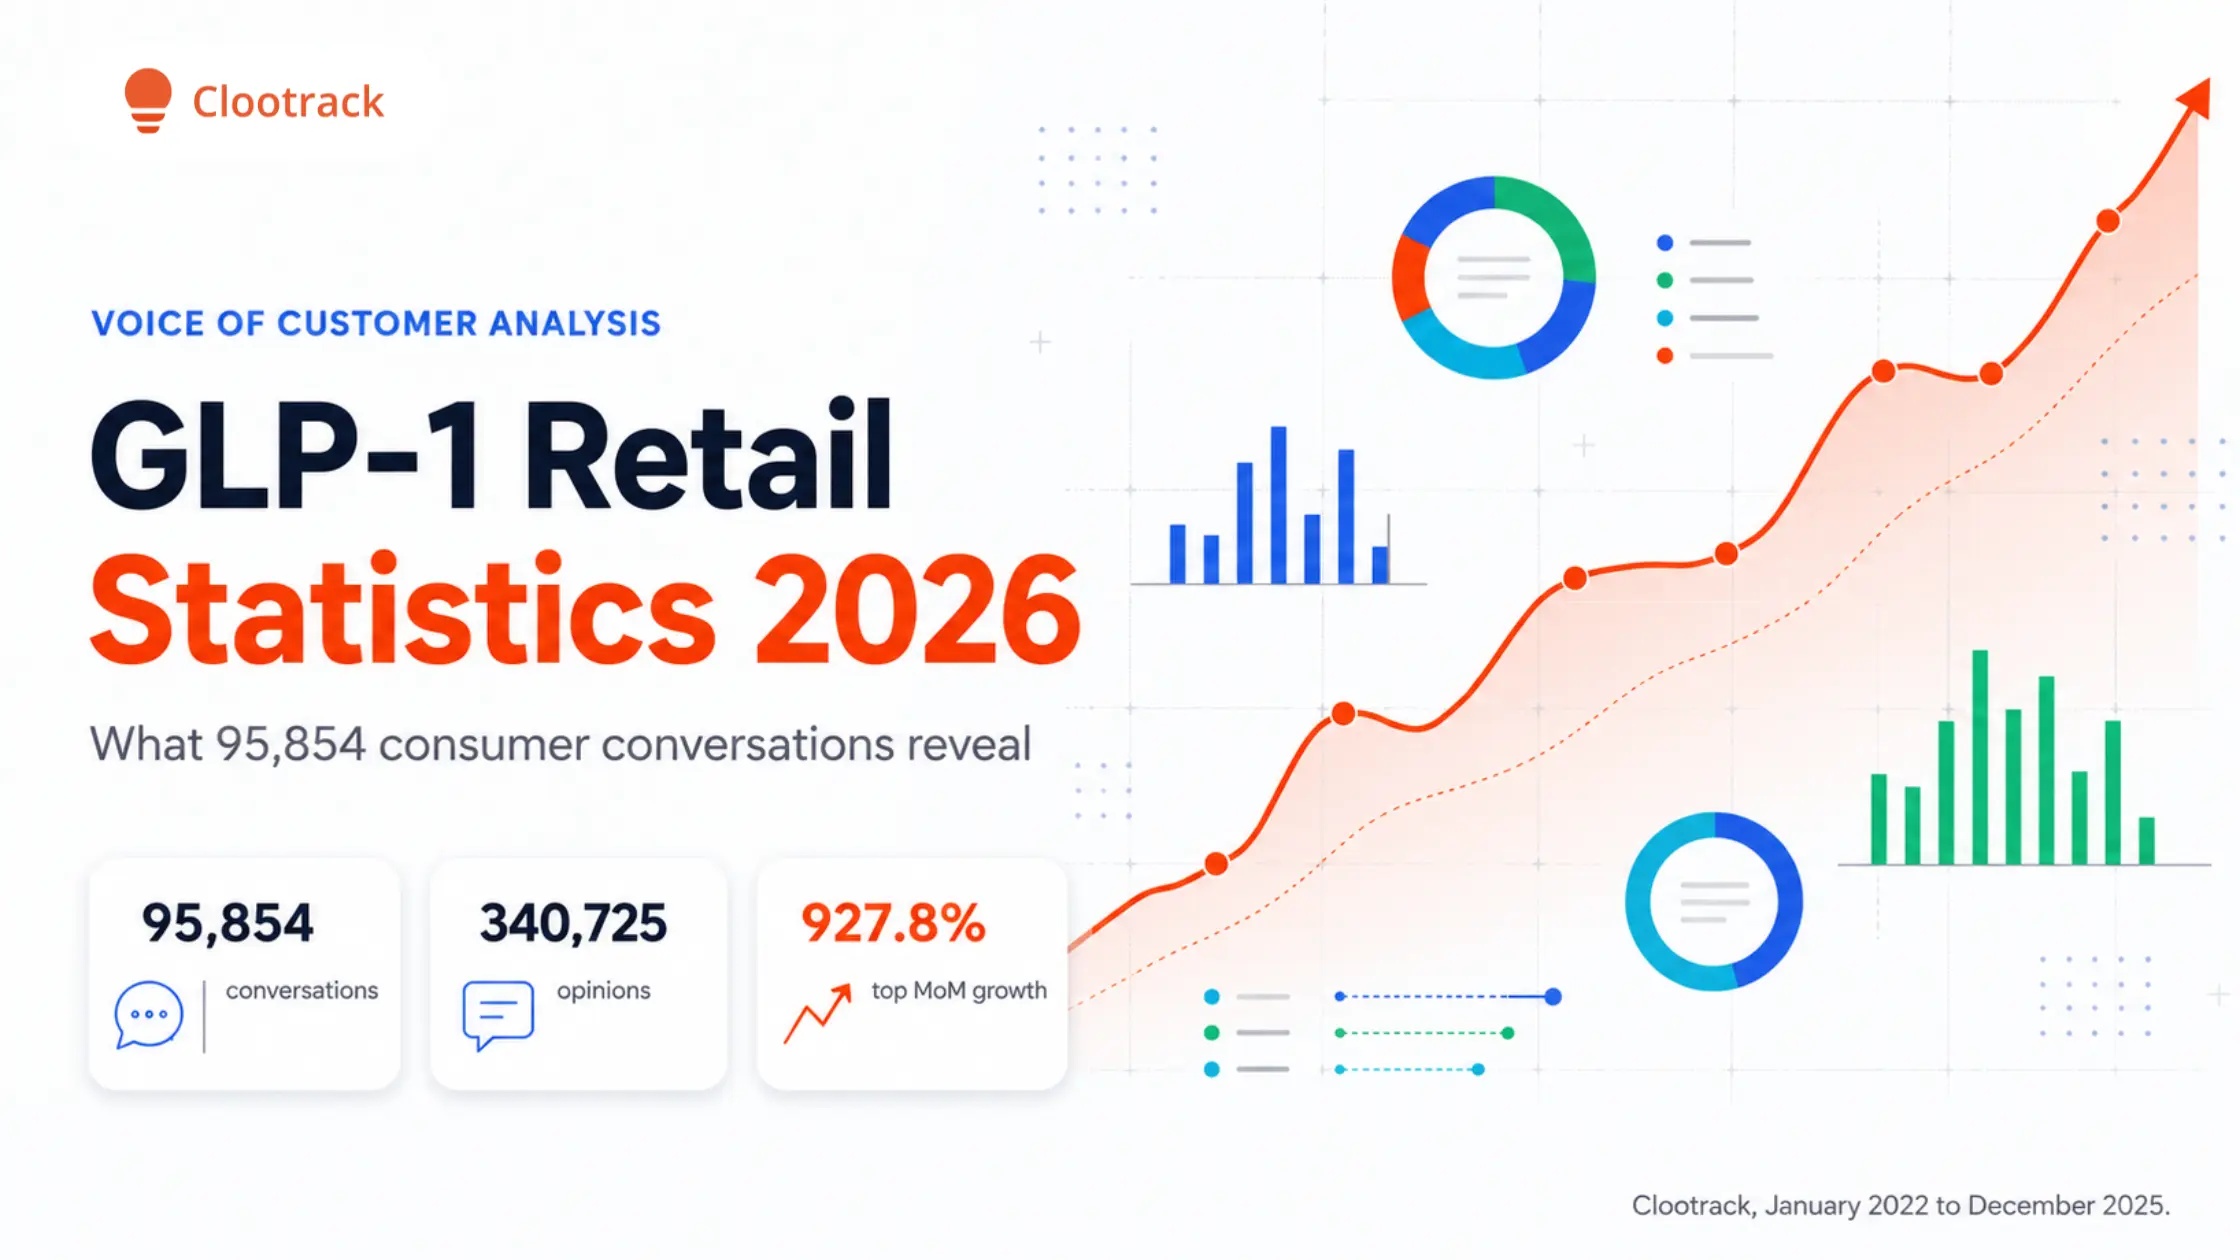
The statistics on this page come from one dataset: 95,854 U.S. GLP-1 consumer conversations and 340,725 extracted opinions, collected between January 2022 and December 2025 and processed at 98% analysis accuracy. The analysis operates at the opinion level, not the document level, so a single conversation can contribute multiple signals across behavioral domains.
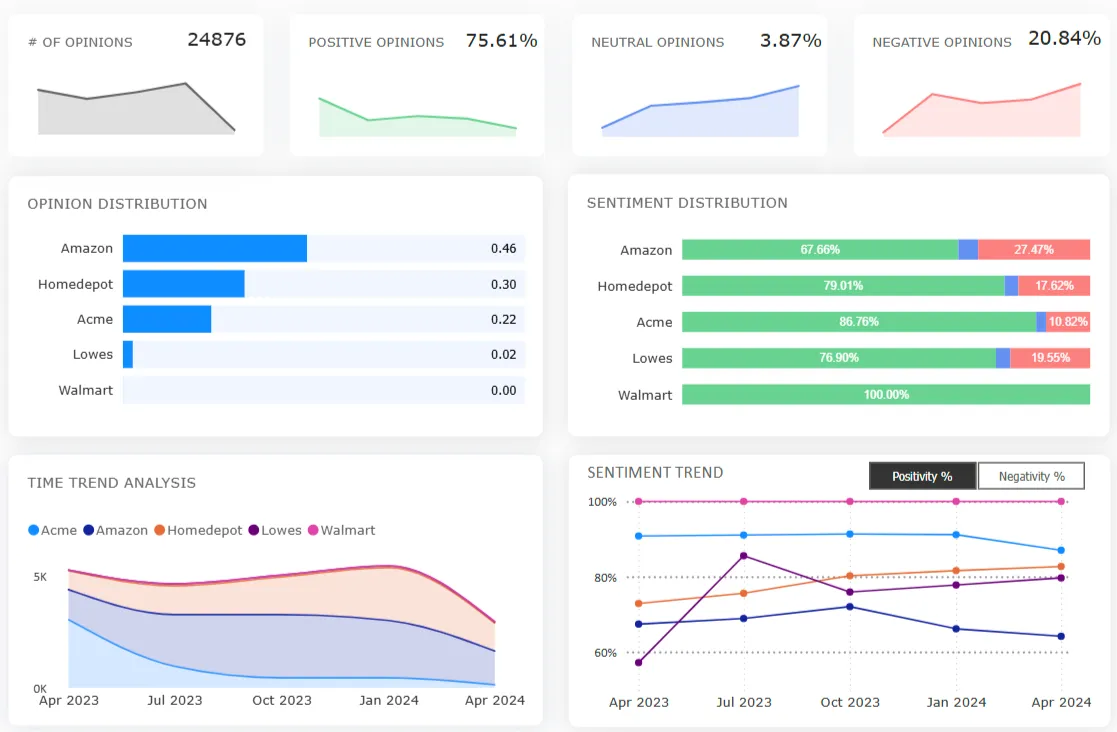
Overall sentiment across the dataset runs 40.1% positive, 28.4% neutral, and 32.0% negative. The five macro dimensions, surfaced by unsupervised detection rather than predefined categories, break down as Medication 39.3%, Physical Health 31.2%, Lifestyle and Activity 14.5%, Food and Beverages 13.1%, and Appearance 3.1%.
See also: What Is GLP-1 Retail Impact? for the framework behind these figures.
Consumption signals are dominated by a dose-driven weekly rhythm and the side-effect management systems built around it. The headline pattern is sentiment asymmetry: symptom themes sit at very low positivity while the solution themes attached to them grow fast and skew positive.
Across the full Side Effects theme, 20,988 opinions register just 22.7% positivity against 61.1% negativity, the low-positivity problem that drives high-positivity solution demand.
See also: The GLP-1 dose calendar effect in grocery retail.
Movement signals are driven by restored capability rather than fitness ambition, with a second, negative-sentiment signal accelerating beneath it: muscle retention anxiety.
Muscle Mass Changes is the only major movement theme where sentiment skews negative despite high growth, the signature of preservation behavior rather than transformation.
See also: The GLP-1 preservation economy in fitness retail.
Apparel signals show desire and hesitation coexisting: body image positivity is divided, transition costs are rising, and an early confidence-recovery signal is building fast off a small base.
The pattern: traffic rises while conversion stalls, because identity adjustment lags physical change.
See also: How GLP-1 is stalling apparel conversion.
Beauty conversation has shifted from celebration to repair, and it contains the single fastest-growing theme in the entire dataset.
Cosmetic Interventions at 927.8% month-over-month is the highest growth rate recorded anywhere in the dataset, and it is driven almost entirely by non-surgical, repair-oriented solution-seeking.
See also: The GLP-1 beauty repair economy.
Spending signals show reallocation, not contraction. Alcohol is the largest shift, and the data suggests much of it is physiological rather than discretionary.
Alcohol Tolerance (331.7%) and Alcohol Sensitivity (291.8%) grow far faster than intentional Reduction (79.4%) and Abstinence (98.2%), and both sit at low positivity, suggesting the shift is the body deciding rather than a deliberate health choice.
See also: The GLP-1 wallet reorganization.
Ranked by month-over-month growth, these are the fifteen fastest-accelerating signals in the dataset. The list is weighted toward repair, preservation, and financial-reframing themes, which is the clearest evidence that demand is reorganizing rather than declining.
Discretionary food exit accelerating
For the full narrative behind these numbers, see the pillar analysis: The GLP-1 effect on retail in 2026.
Cosmetic interventions, at 927.8% month-over-month growth, the highest growth rate recorded in a dataset of 95,854 consumer conversations. It is driven almost entirely by non-surgical, repair-oriented solution-seeking in response to facial deflation.
95,854 U.S. GLP-1 consumer conversations, from which 340,725 individual opinions were extracted, covering January 2022 to December 2025 at 98% analysis accuracy.
The data indicates redistribution, not contraction. Defensive categories such as protein (66.2% MoM), produce (81.8% MoM), and hydration (99.3% MoM) grow while consumers reframe spending as a net financial positive (savings theme at 349.4% MoM).
Alcohol. Alcohol intake conversations grow 81.3% month-over-month, and tolerance and sensitivity subthemes grow 331.7% and 291.8% respectively at low positivity, indicating a largely physiological shift that may not respond to promotion.
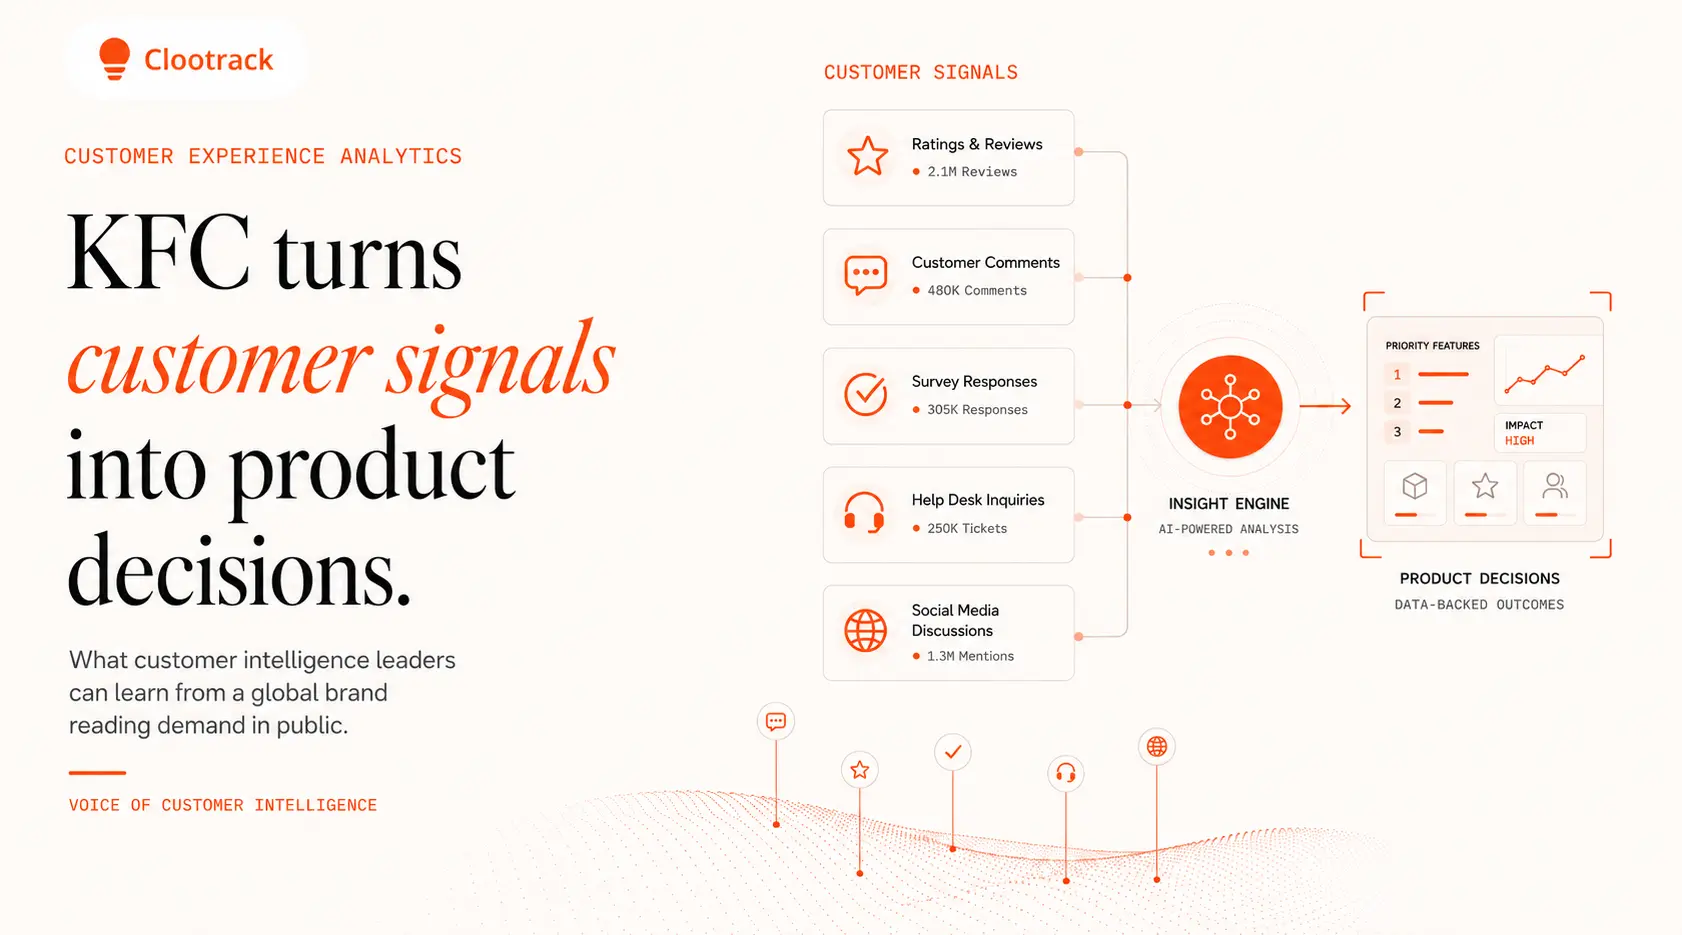
Clootrack's Voice of Customer analytics platform, which analyzes unsolicited consumer conversations from forums, social media, and review sites to detect demand shifts before they appear in transaction data. Figures are directional signals from conversation data, not verified sales figures.
Across all 340,725 opinions, sentiment runs 40.1% positive, 28.4% neutral, and 32.0% negative. The neutral share matters for retail because it often signals hesitation or evaluation rather than satisfaction, the pre-purchase uncertainty that shows up in conversation before it reaches a conversion decision.
Share :
Analyze customer reviews and automate market research with the fastest AI-powered customer intelligence tool.
.webp)
