VoC analysis for fit consistency: what to track beyond size charts to reduce returns and churn

Last Updated:
March 11, 2026

Reading time:
Time
mins

Fit consistency is not solved by better size charts alone. The metrics that reduce returns and churn are the ones that measure repeatability and trust: sizing consistency by component (waist, inseam, rise), wash and SKU-level variance, bracketing language signals, PDP expectation gaps, and return or exchange friction tied back to fit uncertainty. These signals explain why customers reorder less and return more, even when fit satisfaction is high.
In Clootrack’s 2026 U.S. men’s denim analysis, the core pattern is not “customers hate fit.” It is more nuanced and more expensive. Fit satisfaction remained strong, while sizing repeatability confidence stayed weak. In other words, customers liked the jeans when they got the right pair, but they did not trust the next purchase to fit the same way.
That gap is where churn and returns start compounding.
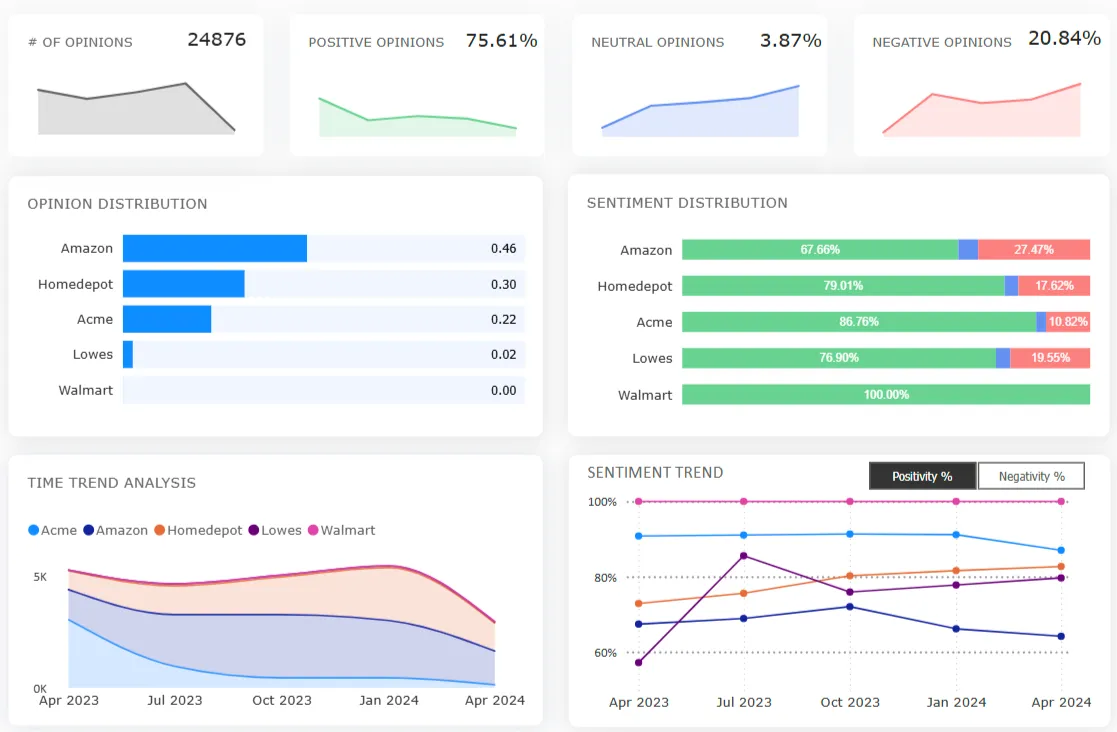
Clootrack’s VoC analysis study findings show denim fit satisfaction at ~87.7% positivity vs sizing reliability at ~59.3% positivity, a split that turns repeat buying into a gamble. This is why brands can still score well on “fit” and lose margin through bracketing, reverse logistics, and trust erosion.
The real signal to track: Denim fit satisfaction vs sizing consistency
Most dashboards collapse “fit” into one line. That masks the problem.
Fit satisfaction tells you if the product worked once. Sizing consistency tells you if the customer will buy again.
Those are different business outcomes.
Our analysis findings show customers adapting to inconsistency by ordering multiple sizes, expecting returns as part of the purchase flow, and losing confidence in same-size reorders. When that happens, the brand may still generate revenue, but the economics worsen quietly. That is why fit consistency should be treated as a retention and returns-reduction KPI, not just a merchandising issue.
What VoC analysis tools should track beyond size charts?
If the goal is to reduce fit-related returns, apparel churn, and sizing-driven brand switching, VoC analysis platforms have to go beyond generic “size issue” tags.
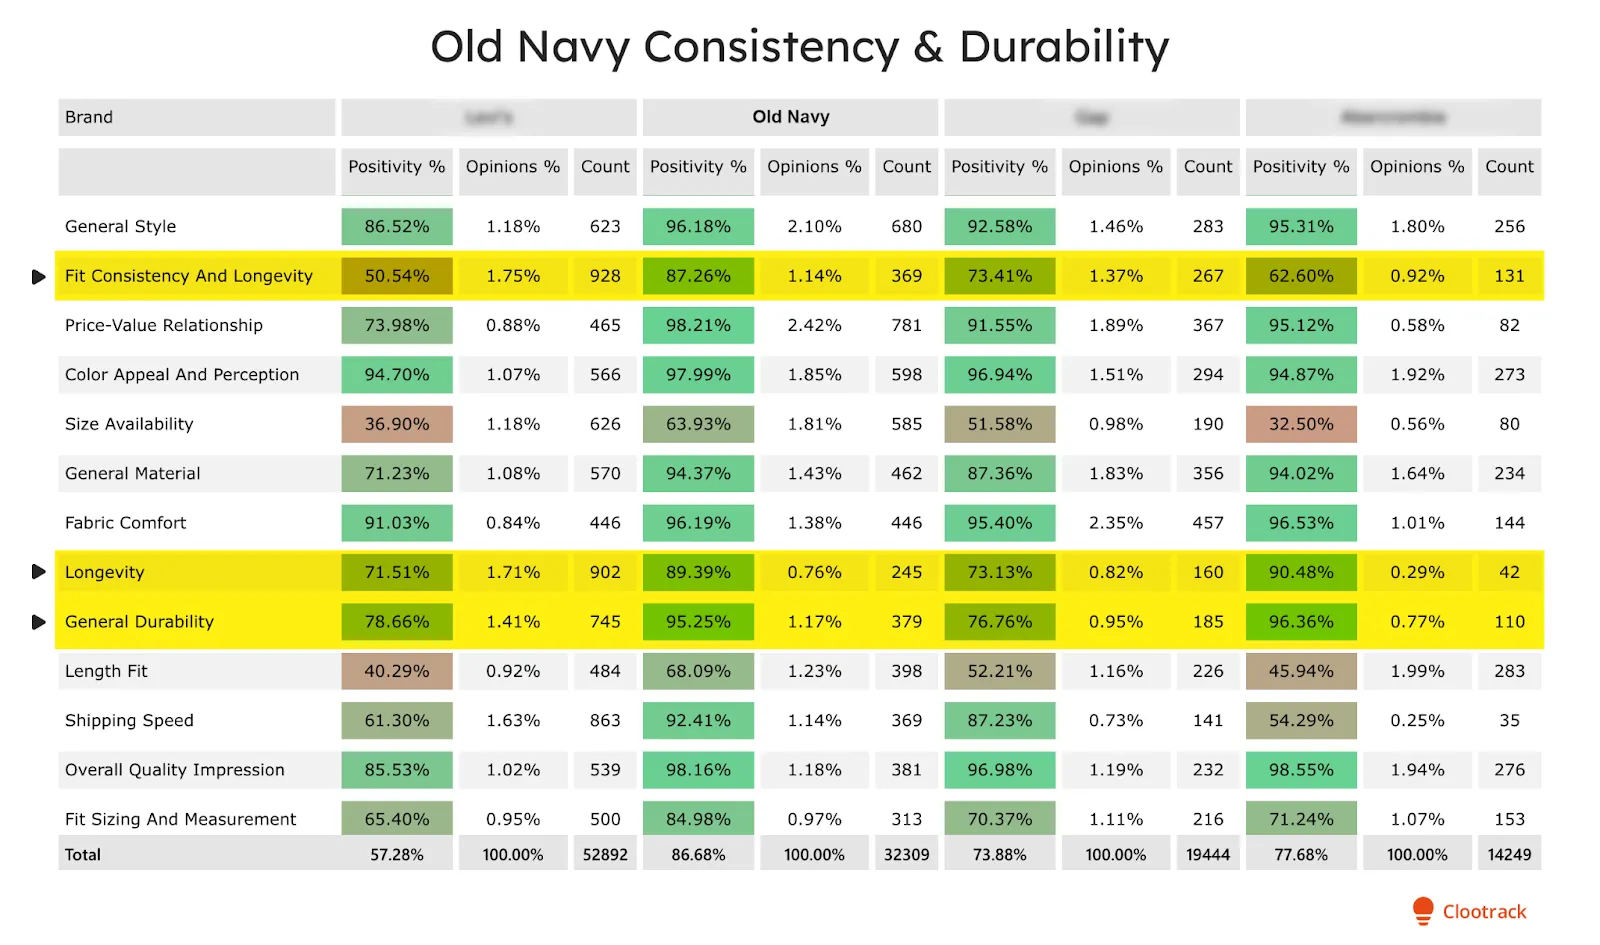
1) Fit consistency by component: waist, length, rise, and stretch behavior
“Fit issue” is too broad to action.
The category data shows friction concentrated in precision-level subthemes, with sizing positivity around 42.1%, length 41.3%, and waist 44.1%. This is exactly where brands should track SKU-level fit risk:
- waist runs small/large
- inseam drift
- rise inconsistency
- stretch recovery differences
- fit variation by wash or fabric blend
This is where return reasons become operationally useful rather than descriptive.
2) Wash-to-wash and SKU-level sizing variation
One of the strongest trust-breakers in the denim study was not “wrong size chart.” It was inconsistent delivery across similar items; same labeled size, different feel across washes, runs, or “identical” SKUs.
That language matters because it signals a repeatability failure, not a one-off complaint. When customers say “same size fits different,” they are no longer evaluating a product; they are evaluating whether the brand is reliable enough to repurchase.
3) Size bracketing signals in customer language (the hidden cost driver)
Returns data shows what came back. VoC shows why extra units were ordered in the first place.
The study findings repeatedly surface bracketing behavior: customers ordering multiple sizes to self-correct for uncertainty, then returning the extras. That increases pick/pack volume, reverse logistics costs, and returns burden on products that are otherwise acceptable.
Track language patterns such as:
- “ordered two sizes”,
- “be ready to try on and return”,
- “same size, different fit”,
- “sized up/down”,
- “probably mislabeled”.
These phrases are often stronger leading indicators of return inflation than the top-line return rate alone.
4) PDP trust breakers beyond size chart accuracy
A clean size chart cannot compensate for weak product detail accuracy.
VoC analytics tools should also track product page accuracy breakdowns that amplify fit uncertainty:
- fabric/stretch mismatch,
- wash/color mismatch,
- misleading fit descriptions,
- labeling inconsistencies,
- description-to-product gaps.
In apparel ecommerce, these issues stack. Once fit confidence is already weak, a PDP mismatch pushes the customer from “inconvenienced” to “misled,” which is a churn decision, not just a return event.
5) Returns and exchange friction linked back to fit confidence
Post-purchase pain should not sit in a separate insights dashboard.
The denim category data shows Returns & Exchanges (17.9% positive) and Product Delivery Condition (17.2% positive) as severe friction zones. If your teams monitor those as isolated support metrics, they miss the root cause chain:
Fit uncertainty → bracketing → avoidable returns volume → exchange friction → churn risk.
For an outcome-oriented VoC analysis for apparel returns, the question you should be asking is: which post-purchase complaints are actually downstream effects of sizing inconsistency?
How fit inconsistency creates hidden cost before churn shows up
The business impact appears before revenue dashboards fully reflect it. Clootrack’s analysis of U.S. men’s jeans links sizing inconsistency to:
- increased pick/pack volume from bracketing,
- elevated return rates on otherwise well-fitting products,
- reverse logistics costs driven by uncertainty, not defects.
This is why fit consistency belongs in customer feedback analytics, returns reduction, and retention conversations at the same time. It affects conversion quality, fulfillment cost, and repeat purchase confidence in one loop.
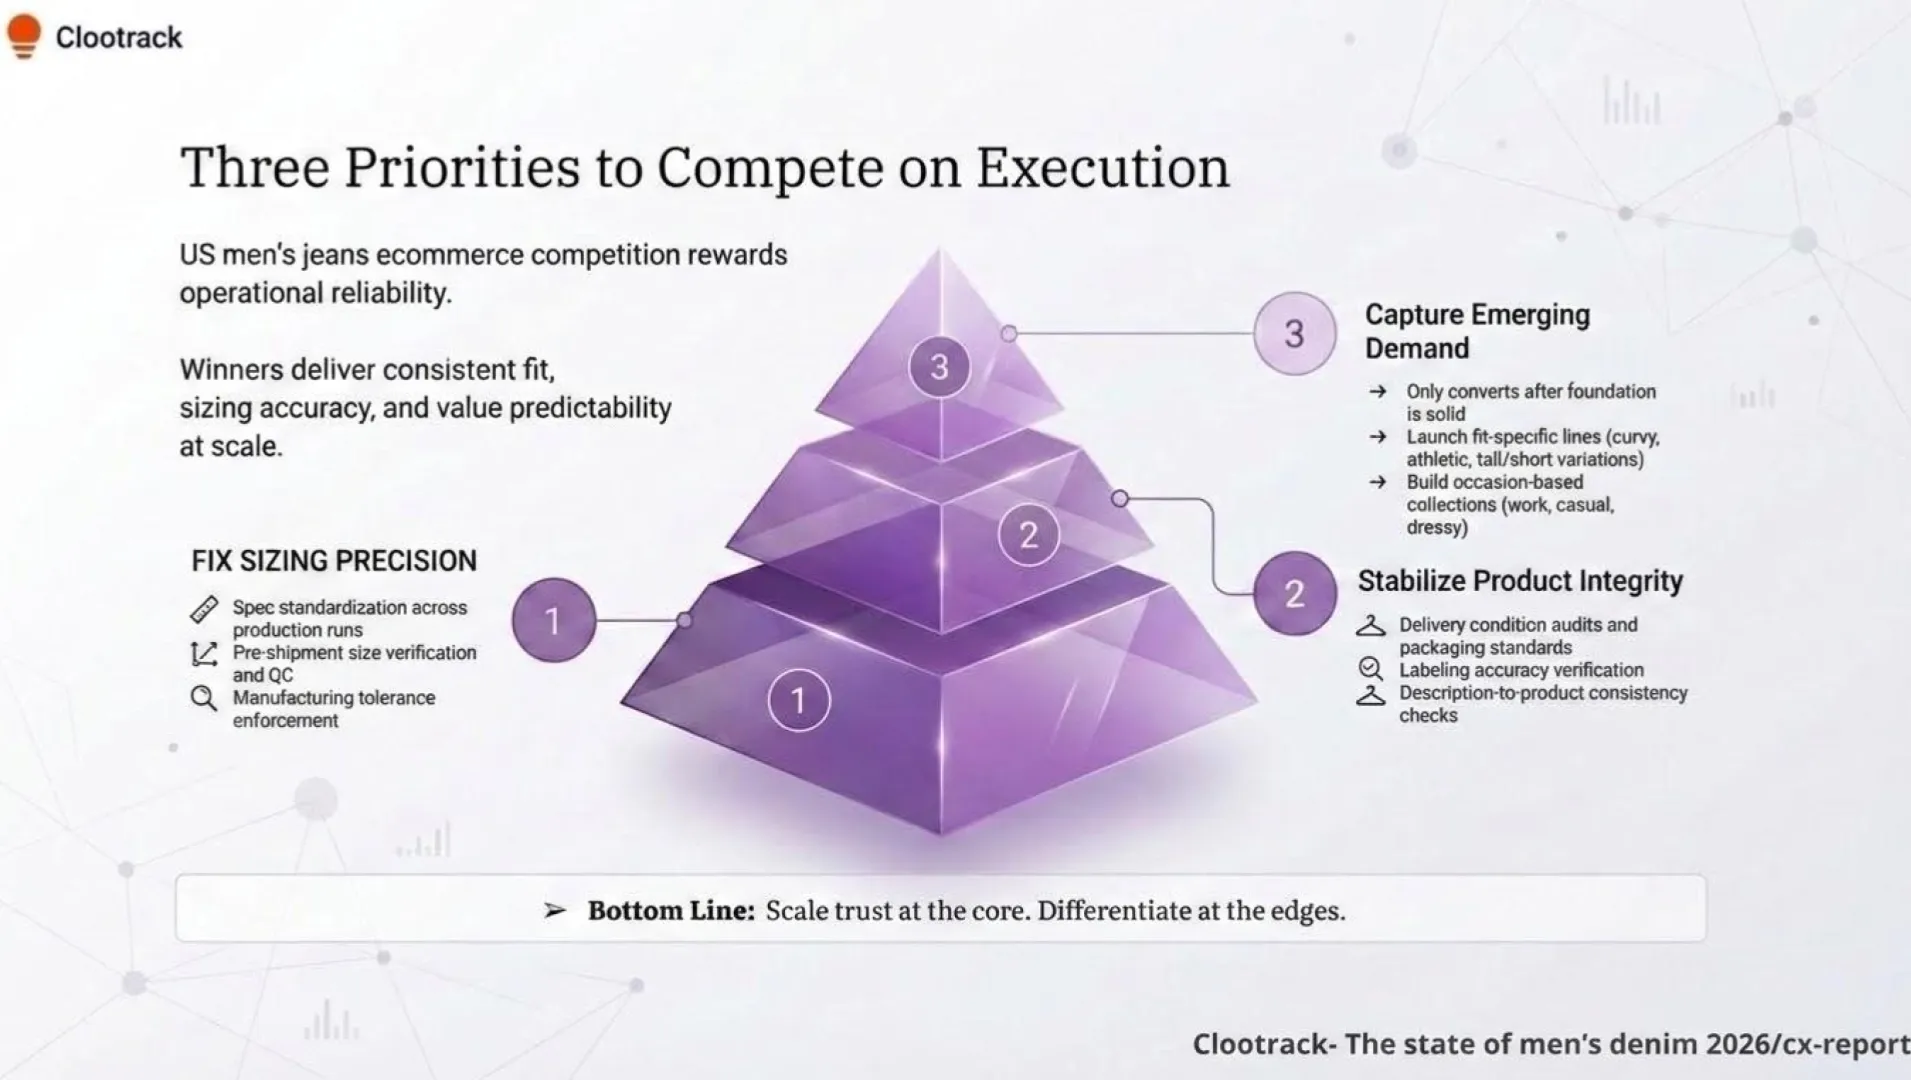
What advanced VoC analysis enables for fit consistency in the retail apparel industry
The value is not another sentiment dashboard. It is the ability to connect customer language to root-cause prioritization and actionable customer insights.
Clootrack’s agentic VoC analytics platform is useful here because it is built for root-cause investigation across mixedand scattered feedback sources (reviews, complaints, tickets, support interactions, surveys, call data). What makes Clootrack VoC tool practical and useful is the combination of:
- Unsupervised thematic analysis (to detect emerging fit/sizing language without waiting for manual taxonomy updates).
- Multi-level drill-downs (so merchants, CX, and ops can move from category → brand → style → SKU → verbatim).
- Traceable evidence (to validate whether a pattern is real before actioning).
- Customizable VoC AI agents to help teams move from “what customers are saying” to “what needs action now,” prioritized by business impact rather than raw mention volume. For example, our AI Returns Analytics Agent isolates preventable return drivers, while the VoC Complaints Analytics Agent flags recurring trust-break patterns before they compound into churn, escalation load, and brand damage.
That combination is what turns fit consistency analysis into an operating mechanism:
- Product teams get variance signals they can act on.
- E-commerce teams get PDP mismatch evidence they can fix.
- CX/support teams get complaint patterns they can de-escalate.
- Leadership gets a clearer view of which issues are inflating returns, weakening repeat purchase confidence, and quietly increasing churn risk.
An advanced VoC strategy is the difference between a brand with good product feedback and a brand with healthy repeat economics.
FAQs
1) What are the key VoC data points for fit consistency?
The key VoC data points for fit consistency are the ones that measure fit reliability, customer effort, and downstream business impact. Track granular fit feedback in reviews, social posts, and support tickets (for example: “runs small,” “tight waist,” “short inseam,” “tight in shoulders”), Customer Effort Score (CES) for how easy it was to choose the right size, SKU-level return and exchange reasons (such as “length inaccurate” or “runs large”), and sentiment/frustration intensity to distinguish minor fit mismatch from churn-risk frustration. It’s also useful to track size-bracketing behavior and CLV/retention by fit-issue segment to quantify how sizing inconsistency affects repeat purchase value.
2) What is the best tool for analyzing VoC data?
The best tool for analyzing VoC data is one that can combine feedback from multiple sources, detect patterns automatically, and help teams prioritize root causes by business impact. Clootrack is an enterprise-grade top VoC analytics tool because it offers unsupervised feedback theme detection, multi-source analysis, drill-down to customer verbatim evidence, and customizable VoC AI agents that help CX, product, eCommerce, and operations teams act on holistic feedback signals.
3) Can a VoC analysis or workshop be used to identify, prioritize, and translate customer needs into CTQs?
Yes, a VoC analysis can be used to identify, prioritize, and translate customer needs into CTQs (Critical to Quality requirements). VoC data helps capture customer needs in real language, then teams can group recurring issues, prioritize them by frequency/severity/business impact, and convert them into measurable quality standards. For example, a customer need like “the same size should fit the same way every time” can be translated into CTQs for sizing consistency, fit-description accuracy, and fit-related exchange rate thresholds. This is a practical way to turn customer feedback into operational decisions.
4) What should you track beyond standard size charts in retail VoC analysis?
Beyond standard size charts, retail VoC analysis should track fit reliability, customer behavior, and expectation gaps. That includes: 1) qualitative fit language (such as “tight waist” or “short inseam”), 2) size bracketing behavior, 3) stretch and comfort feedback, 4) SKU/wash-level inconsistency, 5) PDP mismatch complaints (fit description, fabric, image mismatch), and 6) exchange-versus-refund patterns. These signals explain why customers lose confidence in ordering again, which is what drives repeat returns and churn more than the size chart itself.
5) Can you do customer retention analysis using VoC?
Yes, VoC can be used for customer retention analysis because it helps explain why customers stop buying, reduce purchase frequency, or switch brands. Retention data shows the outcome, but VoC reveals the reasons behind it, such as repeated fit inconsistency, unresolved complaints, exchange friction, misleading product expectations, or “not worth the hassle” sentiment. In retail and apparel, many customers churn after trust declines over multiple interactions, and VoC helps detect that earlier than sales data alone.
Share :
Do you know what your customers really want?
Analyze customer reviews and automate market research with the fastest AI-powered customer intelligence tool.