Retail VoC return analysis for apparel returns: fit variance vs expectation gap vs quality failure

Last Updated:
April 2, 2026

Reading time:
Time
mins

TL;DR
Apparel returns are rarely one problem. They usually come from one of three breakdowns: fit variance where the product changes underneath the size label, expectation gap where the product is fine but the listing was wrong, or quality failure where the item arrives damaged, suspicious, or deteriorates too quickly. Clootrack’s men’s denim VoC analysis report makes the split clear: fit can be well liked, yet sizing repeatability, PDP truth, delivery integrity, and return fairness can still be weak enough to destroy the second purchase. That is why retail VoC return analysis should not start with “why was this returned?” It should start with “which trust layer failed?”
Here’s how to do it properly, as per Clootrack’s 2026 men’s denim VoC analysis findings.
Split fit equity from fit repeatability
Stop grouping everything under "fit issues" in your retail VoC analysis.
Our 2026 men’s jeans trends data makes the distinction explicit:
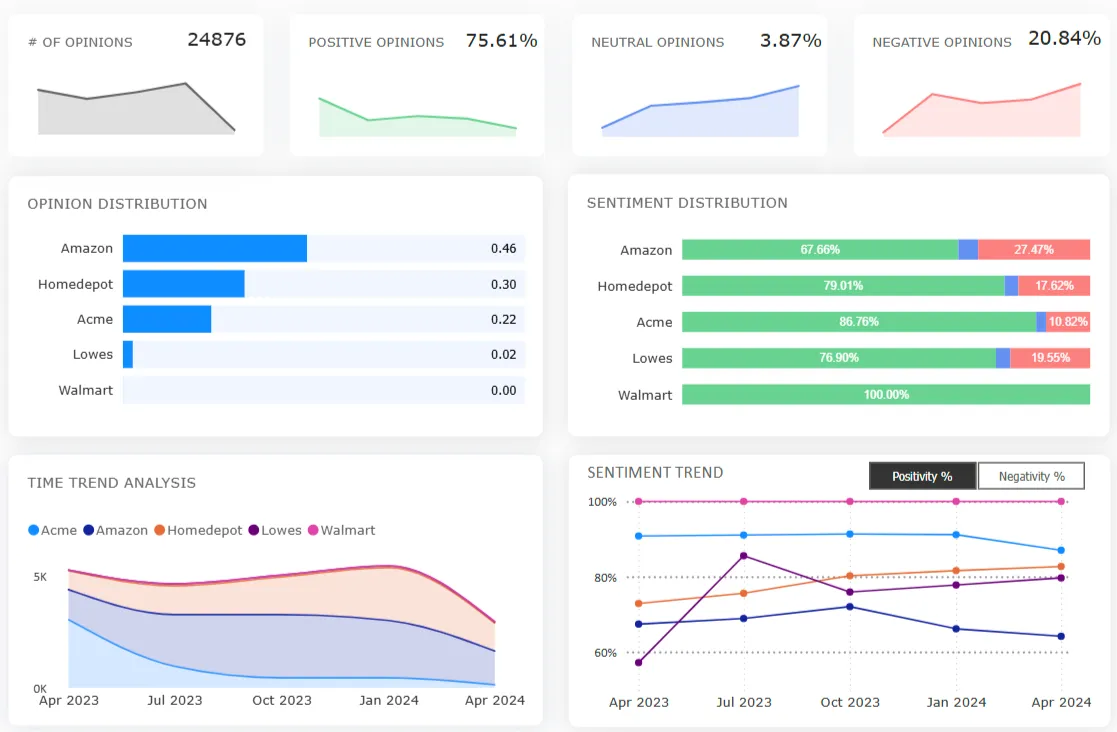
- Fit satisfaction is high (~87.7% positivity), yet sizing reliability is low (~59.3% positivity). That gap is the mechanical source of bracketing behavior and operational waste.
- Customers don’t say, “I dislike the product.” They describe it as “I can’t predict the product,” e.g., “Every pair fits differently… same size, same style – 7 returns.”
When fit equity is strong, but repeatability is broken, returns are driven by fit variance (manufacturing tolerances, grading drift, wash/colorway variance, labeling errors). That is a product + QA problem first, not a CX copy problem.
Operationally, this shows up as: size bracketing, which can create 3–4 operational touches before a purchase is finally kept.
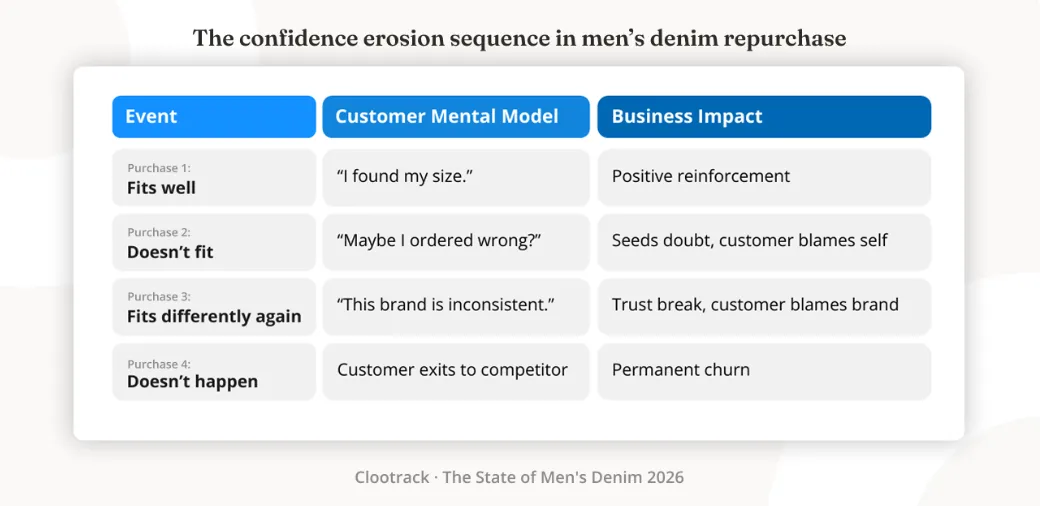
This is the key operating mistake in apparel returns: teams see strong fit sentiment and assume the product is healthy, when the margin leak is actually sitting in repeatability. Customers may like the jeans once, but if they cannot trust the next order, the business still absorbs bracketing, reverse logistics, and a weaker second-purchase base.
Root cause A: fit variance (the product changes underneath the size label)
What it looks like in VoC
- Same customer, same size, different outcome across washes/colors or production runs (light wash fits, black wash tight).
- Precision complaints rising in specific measurements (waist/length).
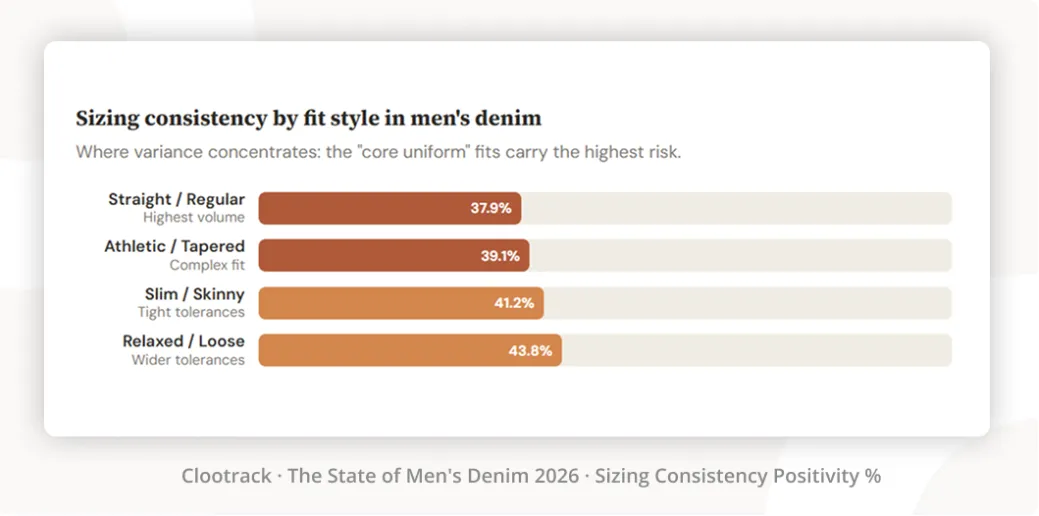
- Concentration in core, high-volume segments (mid-price $50–$100; Straight/Regular fits show the highest unpredictability).
What it changes financially
- Bracketing inflates pick/pack and return handling volume without increasing net demand.
- It damages repeat purchase confidence even when the “right” item is loved.
Owner + fix path (practical)
- Owner: Product engineering + supplier QA + merchandising (spec control).
- Fixes: spec standardization across runs, pre-shipment verification, tolerance enforcement.
- VoC proof you need: measurement-level clusters (waist, inseam, rise) by SKU/colorway/factory—otherwise you’ll debate anecdotes.
The diagnostic test is important: if complaints cluster by wash, factory, batch, or colorway more than by listing language, the issue is usually product variance, not expectation setting. That distinction matters because the fix path sits in spec control, not content correction.
Read now: Most loved men's denim brands in 2026
Root cause B: expectation gap (the product is fine; the promise isn’t)
Expectation gap returns are not “fit variance.” They’re promise variance: the customer received a coherent product, just not the one they believed they bought.
Your dataset highlights how small PDP errors become “dishonesty,” not inconvenience:
- Customers label inaccuracies as “misleading”, not “disappointing.”
- The deck calls out five PDP failure points that reliably break trust and force returns: sizing info, fabric composition, hardware/closure type, brand cue visibility, and color/wash accuracy.
What it looks like in VoC
- “Description says 100% cotton… receives stretch blend.”
- “Button fly vs zip fly,” “wash doesn’t match photo,” missing brand cues triggering counterfeit suspicion.
What it changes financially
- Expectation gaps create hard returns (can’t be fixed by exchange) and a trust penalty that depresses future conversion.
- It also pollutes product feedback: you’ll think you have fit issues when you have listing governance issues.
Owner + fix path (practical)
- Owner: Ecommerce ops + content ops + channel management (not “CX”).
- Fixes: attribute standardization (fabric %, rise, fly), channel-specific content audits, image libraries tied to current production specs. Your own data calls PDP accuracy “first aid” while production fixes are slower.
This is where retail return analysis often goes wrong. Many “fit complaints” are not true sizing failures at all; they are expectation complaints triggered by inaccurate stretch, fabric composition, rise, closure, wash tone, or visual presentation. If the customer ordered against the wrong promise, the return belongs in listing governance before it belongs in product QA.
Root cause C: quality and post-purchase failure
This is the cleanest category, and the one teams still under-instrument because it sits across vendors.
In your dataset, post-purchase breakdown is structurally negative:
- Returns and exchanges: 17.9% positive (887 mentions); Product Delivery Condition: 17.2% positive in men's denim (496 mentions).
- Delivery condition is worsening (~15% positivity) with growth flagged (+13%).
What it looks like in VoC
- Damage-at-delivery, missing parts, packaging failures, “worn/used” condition claims, and exchange/refund friction (fees, deductions). Customers do not separate damaged delivery, refund deductions, unclear return terms, and exchange friction into different internal workflows; they experience all of them as post-purchase negligence. That is why policy friction should be treated as a trust failure, not a minor service irritant.
What it changes financially
- These are direct cost multipliers (reverse logistics + reship + refunds) and disproportionately trigger churn because the customer attributes it to negligence, not preference.
Owner + fix path (practical)
- Owner: Fulfillment + 3PL + marketplace ops + returns operations.
- Fixes: delivery condition audits, packaging standards, and policy clarity on deductions/fees.
Read now: Rethinking CX in men's denim
What your VoC system must do (operator requirements, not vendor claims)
If you can’t do the following reliably, you’ll misdiagnose returns and waste cycles:
- Unsupervised clustering, so “fit variance vs promise variance vs damage variance” emerges from language without forcing a taxonomy up front. Clootrack positions this as patented unsupervised theme analysis.
- Traceability to verbatims for every “root cause” claim because returns debates die in trust gaps.
- Multi-source stitching (reviews + tickets + calls + return reasons) because each channel hides a different part of the failure. Clootrack’s VoC platform centralizes VoC ingestion by consolidating feedback data from 1,000+ connectors.
- Decision-ready triage: prioritize what moves margin now vs what’s a longer product fix (your deck already frames PDP as immediate first aid).
Bottom line
Not every CX return driver should be handled on the same timeline. Expectation gaps usually move first because PDP and channel-content corrections are the fastest intervention. True fit variance should come next because it creates repeat operational waste across high-volume SKUs. Quality and post-purchase failures should be treated as churn accelerators because they damage trust after the customer has already committed.
Your end goal is not to reduce returns in the abstract. It is to identify which trust layer is failing, assign the right owner, and remove the most expensive source of repeatable leakage first.
FAQs
1. What is VoC analysis for retail returns?
VoC analysis for retail returns helps brands identify the real reasons products are returned, not just report return rates. It separates fit variance, ecommerce expectation gaps, and post-purchase issues like delivery damage or refund friction. That makes retail return reduction more accurate, actionable, and easier to assign to the right team.
2.What is a good return rate for ecommerce retailers?
A “good” return rate depends on the category. Recent benchmark sources place apparel and footwear much higher than other categories, often in the mid-teens up to 40%, while electronics and beauty tend to be lower. The better question is whether returns are clustering by SKU, size, or channel, because that reveals where margin leakage is actually coming from.
3. How can retailers reduce return rates?
Retailers reduce return rates by improving size guidance, product detail pages, photos, descriptions, and post-purchase quality control. The highest-impact fixes usually come from identifying whether returns are driven by fit variance, expectation gaps, or delivery and refund friction. VoC makes those patterns visible across reviews, tickets, and return reasons.
4. How do customer reviews help reduce product returns?
Customer reviews help reduce returns because they reveal why customers send products back, often in more detail than structured return codes. Research from Amazon Science found review text can improve prediction of return reasons and surface issues like misleading descriptions, manufacturing defects, seller problems, and shipping-related failures.
Share :
Do you know what your customers really want?
Analyze customer reviews and automate market research with the fastest AI-powered customer intelligence tool.