Customer feedback analytics for returns: VoC strategy to protect customers from bad policies

Last Updated:
April 7, 2026

Reading time:
Time
mins

TL;DR: 48% of all retail returns in 2025 were classified as "significantly not as described" (SNAD). Only 9% are confirmed fraud. The 39-point gap between those numbers is where return policy mistakes originate: brands misclassify product variance (sizing drift, PDP inaccuracies, delivery condition failures) as fraud, tighten policies on legitimate customers, and accelerate switching to competitors. This KB covers how to build a return-feedback classification system using a three-link VoC trust chain framework, backed by category-level Voice of the Customer data from a Clootrack jeans customer review analysis of 55,287 reviews.
What is customer feedback analytics for returns?
Customer feedback analytics for returns is the practice of classifying return-related language, from reviews, support tickets, and post-purchase surveys, into root-cause categories before it enters fraud-scoring models.
The core categories are: sizing/fit failure, listing-to-product mismatch, delivery condition issue, policy friction, and actual fraud. Without this classification layer, fraud-detection systems absorb legitimate product complaints into their risk models, inflating fraud rates and triggering policy responses that punish honest customers.
This matters at scale. U.S. retail returns totaled $849.9 billion in 2025, a 15.8% return rate. E-commerce return rates remain higher at an estimated 19.3%. Each return costs retailers an average of $25 to $30 in shipping, processing, and handling. When brands can't distinguish between "this product didn't match the listing" and "this customer is gaming the system," both the fraud budget and the return budget leak.
Why do product variance complaints look like fraud signals?
Product variance and fraud share nearly identical surface language because both describe a gap between what was promised and what was received. The difference is the source of the gap, and that's invisible at the transaction level.
"Significantly not as described" (SNAD) returns accounted for nearly half (48%) of all returns in 2025, according to Signifyd. That category includes damaged items as well as merchandise that didn't match customer expectations. 9% of all returns in 2025 are classified as fraudulent (NRF/Happy Returns). The remaining 39 percentage points sit in a classification gray zone.
Three categories of product variance generate the most false positives in fraud systems:
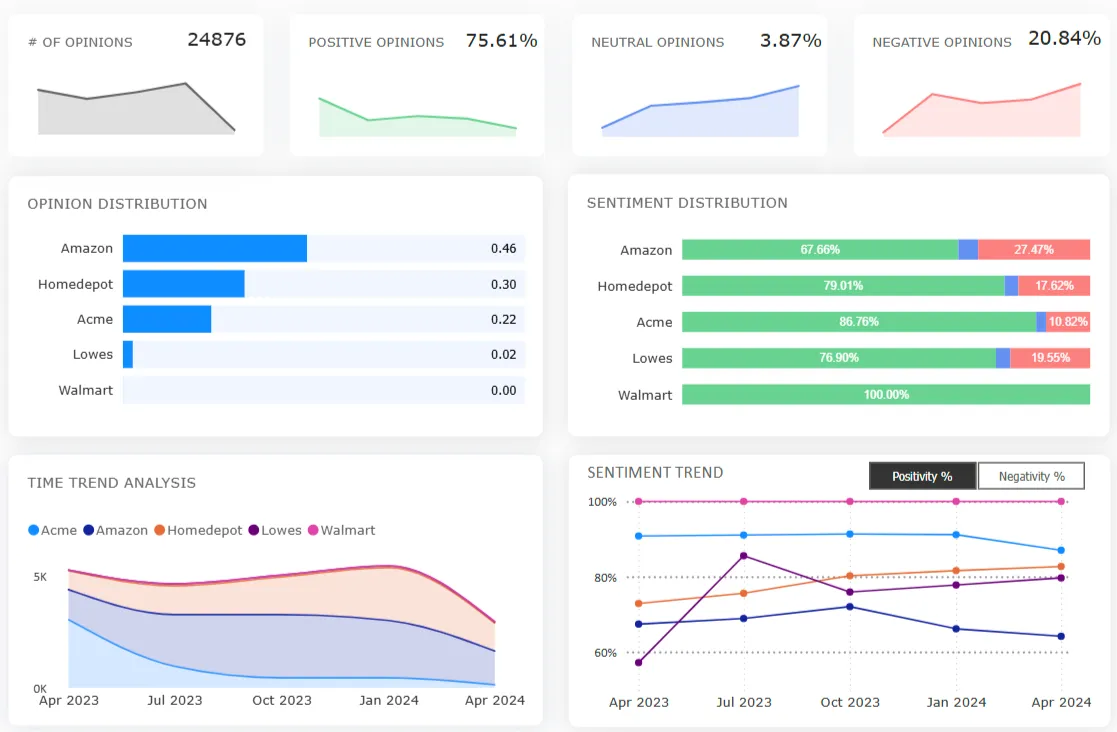
Sizing and measurement drift. Clootrack’s VoC analysis of men’s denim customer reviews in the U.S. found that jeans size consistency sits at just 16.5% positivity (841 opinions). Customers who reorder the same size in the same style and receive a different fit use language like "mislabeled," "wrong item sent," or "sizing is all over the place." Those phrases trigger fraud flags. The cause is manufacturing tolerance variance across production runs.
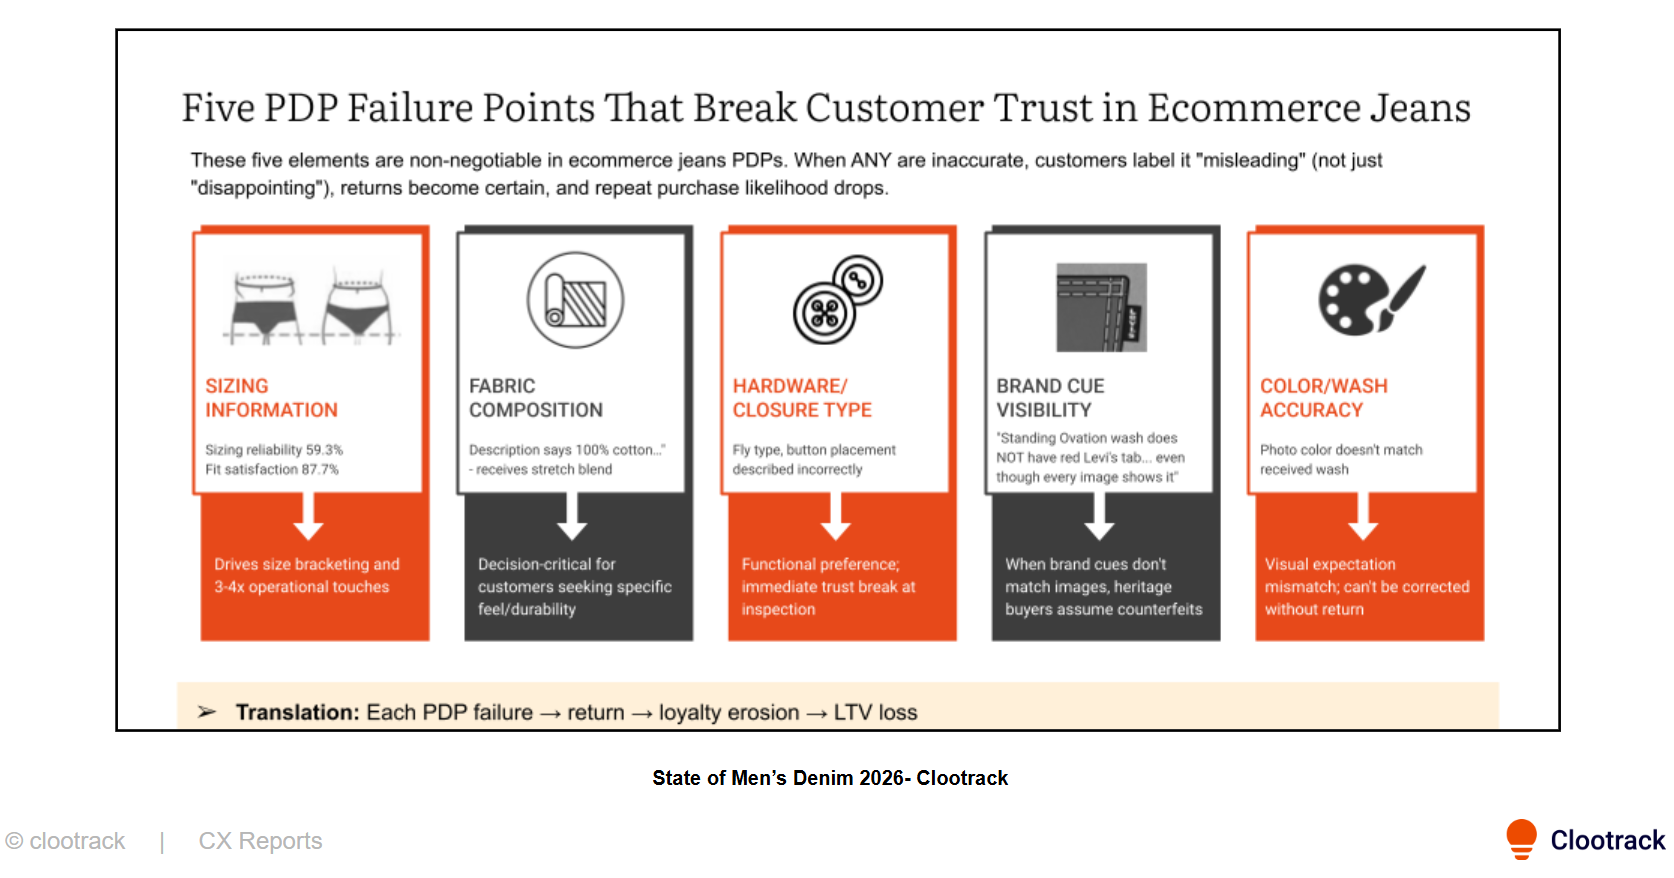
Listing-to-product mismatches. Denim product description accuracy in the same dataset sits at 41% positivity across 5,821 opinions. When fabric composition, color, or hardware don't match the listing, customers use the word "misleading", which appears at 1.68% positivity, near-universal rejection. Fraud systems flag the dispute. The root cause in most causes is a denim brand switching is a PDP content management failure.
Delivery condition failures. "Significantly Not As Described" (SNAD) claims accounted for 63% of all returns initiated in January 2026, driven in part by gaps between product listings and received items. In the Clootrack denim dataset, odor at arrival sits at 3.21% positivity (187 opinions) and defects/damage at 4.52% (221 opinions). Customers who unbox items that smell like chemicals or show stains conclude the item was previously worn: a "used product" flag in fraud systems, caused by finishing processes or warehouse handling.
The classification test: If a "not as described" complaint clusters around specific SKUs, fulfillment nodes, or production batches, it's product variance. If it's dispersed across random products and accounts, it warrants fraud investigation.
What happens when return policies are tightened based on misclassified signals?
Read next: How to reduce retail and e-com apparel returns?
Misclassification creates a three-stage cascade: policy restriction → legitimate customer friction → competitor subsidization.
Stage 1: Restriction. When product variance inflates fraud metrics, the operational response is predictable — shorter return windows, restocking fees, and additional verification. 82% of consumers consider free returns a key purchase factor (NRF/Happy Returns). 81% of consumers review return policies before purchasing. Tighter policies don't filter out fraud. They filter out risk-averse buyers.
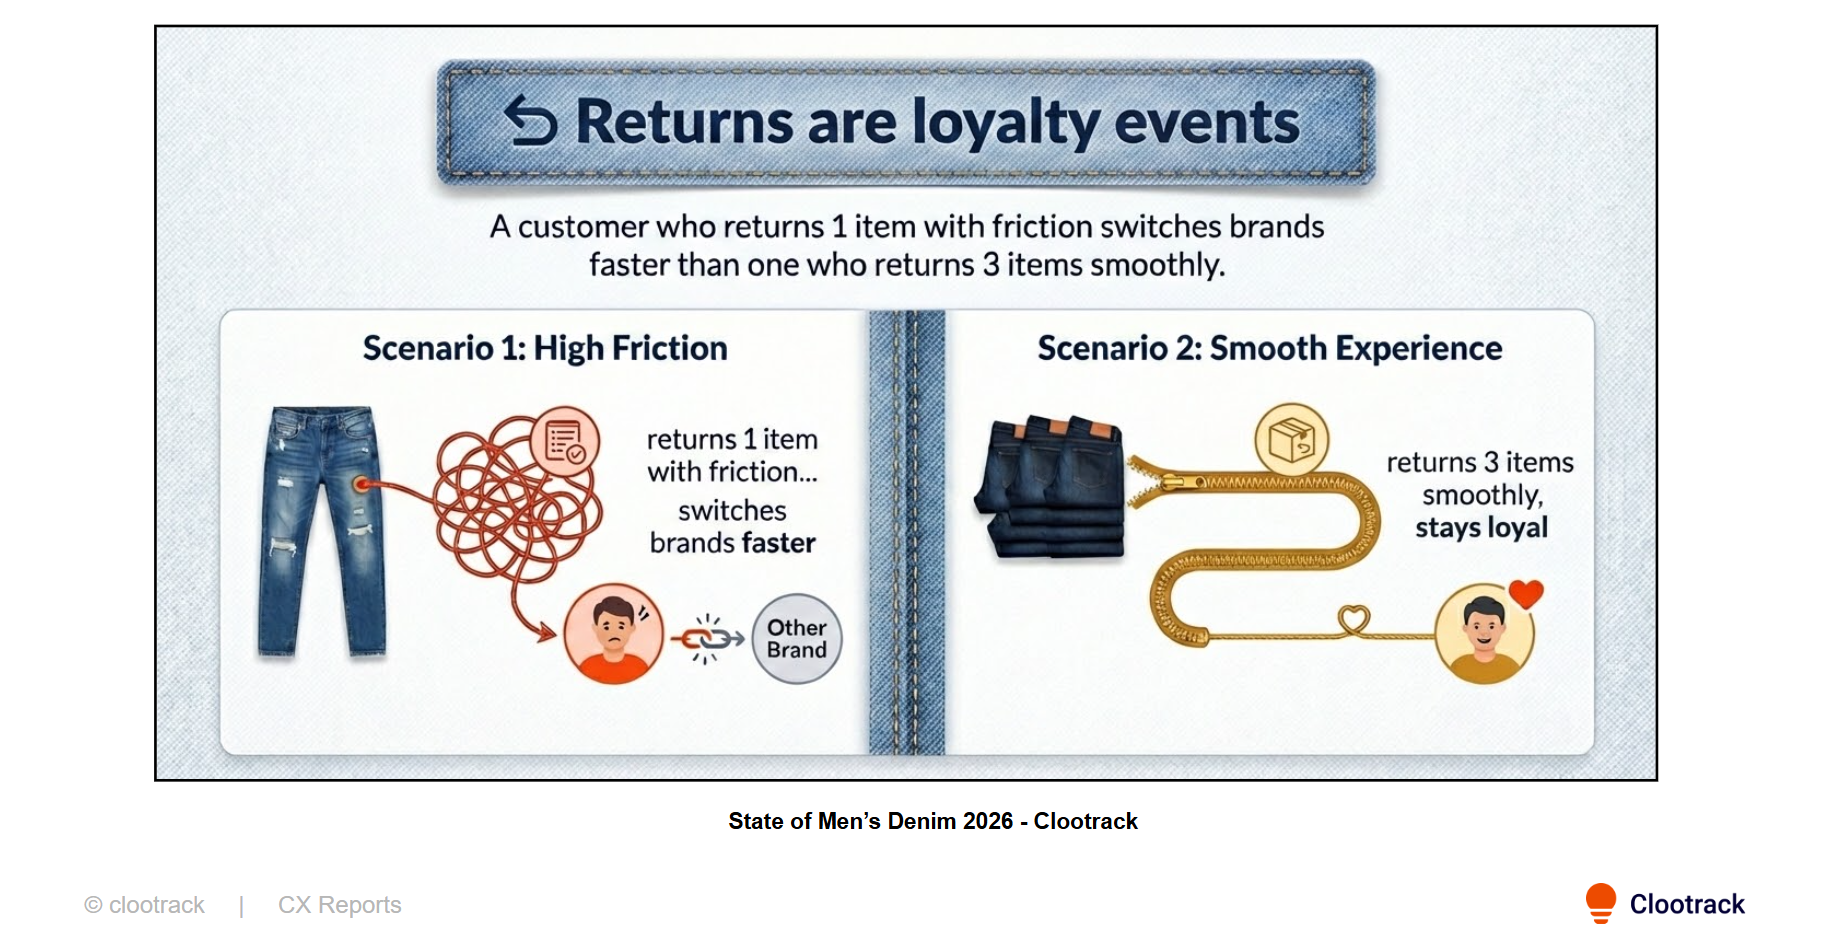
Stage 2: Friction-driven churn. The Clootrack denim sentiment analysis found that return friction predicts brand switching more reliably than return frequency. A customer who returns three items with zero friction stays. A customer who returns one item and encounters a policy surprise: unexpected fee, delayed refund, and unclear rules, switches. Return restrictions in the dataset sit at 0.39% positivity across 257 opinions: near-universal frustration when triggered.
Stage 3: Competitor capture. Nearly 50% of outbound brand switching in the denim dataset is driven by gaps in quality, durability, and consistency, not style preference. The brands capturing positive switching momentum (American Eagle +33, Gap +29, Old Navy +25, collectively 91% of positive net flux) share one operational trait: lower returns friction. Every restrictive return policy becomes a competitor acquisition subsidy.
Key finding (Clootrack, 2026): Brands with the lowest returns friction scores capture disproportionate switching momentum, not because they tolerate more fraud, but because they don't punish product failures as if they were fraud.
How should return feedback be classified before entering fraud scoring?
Use a three-link "trust chain" verification framework. Each link has a measurable red-flag threshold. Returns should only enter fraud-scoring workflows after all three links are verified.
Trust chain = promise → proof → recovery
Link 1 — Promise (listing accuracy). For every return tagged "not as described" or "misleading," verify PDP accuracy for that SKU. If the listing contains a factual mismatch, wrong fabric composition, outdated photography, or inaccurate measurements, classify it as a content failure.
- Red-flag threshold: PDP mismatch complaint rate exceeding 5% per SKU triggers listing lock until verified.
Link 2 — Proof (delivery integrity). For returns tagged "worn," "used," "smells," or "damaged," check delivery condition data for that fulfillment node or carrier lane. If multiple customers from the same node report similar complaints, classify them as fulfillment failure.
- Red-flag threshold: Delivery condition complaints exceeding 2% of shipments from a specific node.
Link 3 — Recovery (process fairness). If the customer encountered unexpected fees, unclear rules, or slow refunds, the complaint may be amplified frustration rather than fraud. Returns and exchanges in the Clootrack denim dataset carry 17.5% positivity across 1,879 opinions; the recovery experience is structurally adversarial.
- Red-flag threshold: Returns friction score above 3.0 on a 5-point difficulty scale.
Only after all three links are clear: accurate listing, clean delivery, transparent process, should the return enter fraud-scoring models.
What is the ROI of fixing the classification problem?
The return on fixing classification is a multiple of what fraud-tightening saves, because it addresses the 86% of retail return costs that trace to legitimate returns, not the 2% that trace to confirmed fraud.
Industry-level breakdown: $706 billion in total merchandise was returned in 2025; of that total, 14.2% or $100 billion was preventable loss from fraud and abuse. 12% of returns-related loss was attributed to returns abuse, while fraud made up only 2%.
Category-level proof: The Clootrack denim analysis estimates that fixing sizing consistency alone reduces returns by 10%, increases reorder rates by 15%, and cuts CX contacts by 20%; delivers an impressive 3–5x ROI within 18 months.
Sizing, fit, and color issues cause 45% of all returns. Product damage accounts for 16%, and inaccurate descriptions cause 14%. That's 59% of return volume traceable to product variance, not buyer dishonesty, and addressable through upstream operational fixes (manufacturing tolerance control, PDP accuracy governance, delivery condition monitoring).
The math: Every dollar spent correctly classifying returns and fixing upstream causes earns back multiples in retained customers, reduced reverse logistics costs, and recovered margin. Every dollar spent tightening fraud policy on misclassified variance accelerates customer defection.
Bottom line
The retail returns problem in 2026 is a classification problem, not a fraud crisis. Build the classification system first. Fix the operations that create fraud-like language. Then tighten policy on the 9%, not the 91%.
FAQs
1. What is customer feedback analytics for returns?
Customer feedback analytics for returns is the practice of classifying return-related language from reviews, support tickets, and surveys into root-cause categories: sizing failure, listing mismatch, delivery damage, policy friction, or fraud, using theme-level sentiment analysis rather than generic return-reason codes. It exists because surface-level return data can't distinguish between a customer who received the wrong product and one gaming the system. In 2025, 48% of all returns were filed as "significantly not as described" (Signifyd), but only 9% were confirmed as fraud (NRF). AI-powered feedback analytics tools like Clootrack close that 39-point classification gap.
2. How do you analyze return reasons in retail?
Analyze return reasons in retail by collecting return data at the SKU, size, channel, and customer level, then grouping it into patterns such as fit issues, quality defects, shipping damage, wrong item, or expectation mismatch. The goal is to find repeatable drivers, not just count returns, so teams can fix product pages, sizing, fulfillment, or product quality at the source.
3) What are common VoC metrics for retail return analysis?
Common VoC metrics for retail return analysis include return reason rate by SKU, size, channel, or vendor; fit-related complaint rate; damaged or defective mention rate; post-return CSAT or NPS; repeat purchase after return; and negative review volume tied to returns. The best metrics connect the return event to customer loyalty, not just return volume.
4) What is a good return rate for US retailers?
A good return rate stays below your category and channel benchmark. Under 5% is strong in low-return categories, while apparel and ecommerce usually run much higher. Overall, US retailers face average returns around 4.5% year-to-date in 2025, costing nearly $890 billion annually.
5) What are the best practices for designing a loyalty boosting return policy?
A loyalty-boosting return policy should be clear, fast, and low-friction. Keep eligibility and timelines simple, offer easy exchanges and instant refunds where possible, show status updates clearly, and avoid surprise fees. Free or flexible returns matter because shoppers factor them into purchase decisions, and bad return experiences often stop repeat buying.
Share :
Do you know what your customers really want?
Analyze customer reviews and automate market research with the fastest AI-powered customer intelligence tool.