VoC analysis for retail returns: how to quantify margin leakage from sizing + quality variance

Last Updated:
March 2, 2026

Reading time:
Time
mins

Retail returns are typically tracked as a rate. That’s useful for reporting, but it’s not diagnostic.
When the return rate moves, finance sees the loss. But the operator question is different: what’s driving repeatable margin leakage beneath the rate, and which drivers are preventable? In apparel, particularly denim, elevated returns are rarely a demand issue. They stem from repeatability failures: sizing inconsistency and quality variation within products that customers genuinely like.
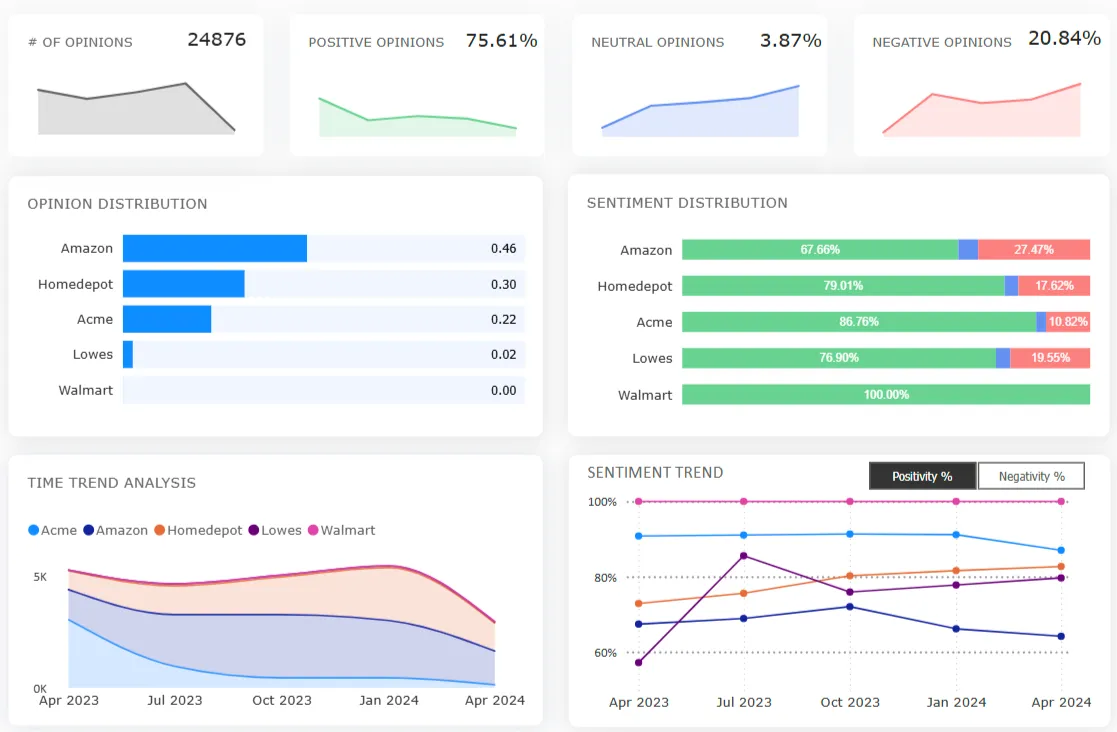
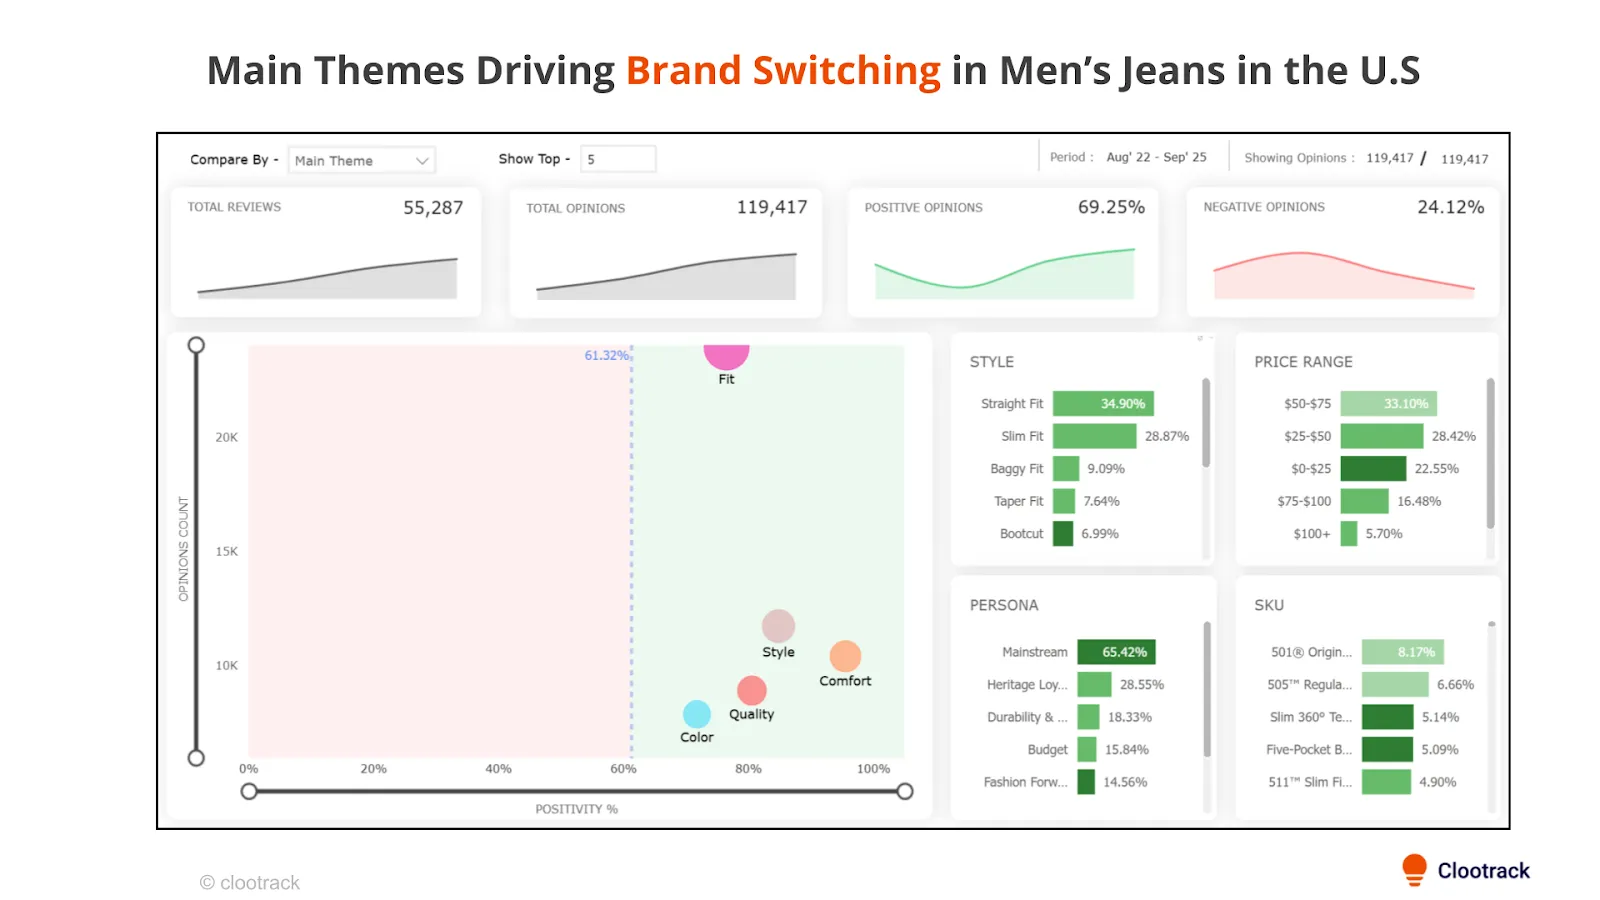
Clootrack’s recent VoC analysis of 55,287 U.S. men’s jeans ecommerce reviews (Aug 2022–Sep 2025) shows a consistent pattern: customers reward fit and comfort, while sizing reliability and post-purchase friction create disproportionate cost and trust damage.
Retail Voice of Customer (VoC) return analysis refers to the structured breakdown of customer feedback signals used to identify why returns happen. It separates sizing variance, quality issues, delivery failures, and expectation gaps, so retailers can attribute margin leakage to specific, preventable root causes rather than tracking return rates alone.
Key components of VoC return analysis:
- Variance attribution over reason codes: replace "too small/poor quality" with root-cause classes: sizing variance, quality variance, PDP/expectation mismatch.
- Operational cost layering: quantify beyond refunds: handling, reverse logistics, bracketing volume, support load.
- Post-purchase execution signals: returns process and delivery condition are independent pain points, not just product issues.
- SKU-level prioritization: concentrating analysis where volume + variance overlap (highest margin recovery potential).
Why retail return rates alone fail to explain margin leakage?
A return rate is a lagging metric. It tells you that leakage occurred, but not whether the loss came from:
- product defect,
- sizing inconsistency,
- PDP mismatch,
- delivery condition failure,
- or customer risk-compensation behavior (like size bracketing).
That distinction matters because these are not interchangeable problems. They sit with different owners, require different fixes, and have different margin impact profiles. In denim ecommerce, what customers describe as “inconsistent sizing” often appears operationally as increased pick/pack volume, elevated returns on otherwise well-fitting products, and added reverse logistics costs driven by uncertainty, not necessarily product defects.
So the first shift in a strong VoC-led returns program is this: stop treating returns as a single-metric problem and start treating them as a variance-attribution problem.
The fit–sizing gap: where hidden margin leakage begins
One of the most useful signals in the analysis is the split between product appeal and delivery reliability:
- Fit satisfaction remains high (~87.7% positivity)
- Sizing reliability remains much lower (~59.3% positivity)
This is not a small nuance. It is the difference between “customers dislike the product” and “customers like the product but cannot trust repeatability.” That is why returns become expensive even when the core product proposition is strong. Customers are not always rejecting the jeans. They are reacting to uncertainty:
- same size fitting differently across pairs,
- fit changing by wash,
- mislabeled or inconsistent sizing outcomes.
Customer verbatims in the analysis make this concrete: “Every pair fits differently… same size, same style - 7 returns,” and “The light wash fit great, but the black wash was too tight.” This is where margin leakage starts compounding. The product can still win on fit once, but inconsistency weakens reorder confidence.
How sizing variance turns into return-driven margin loss
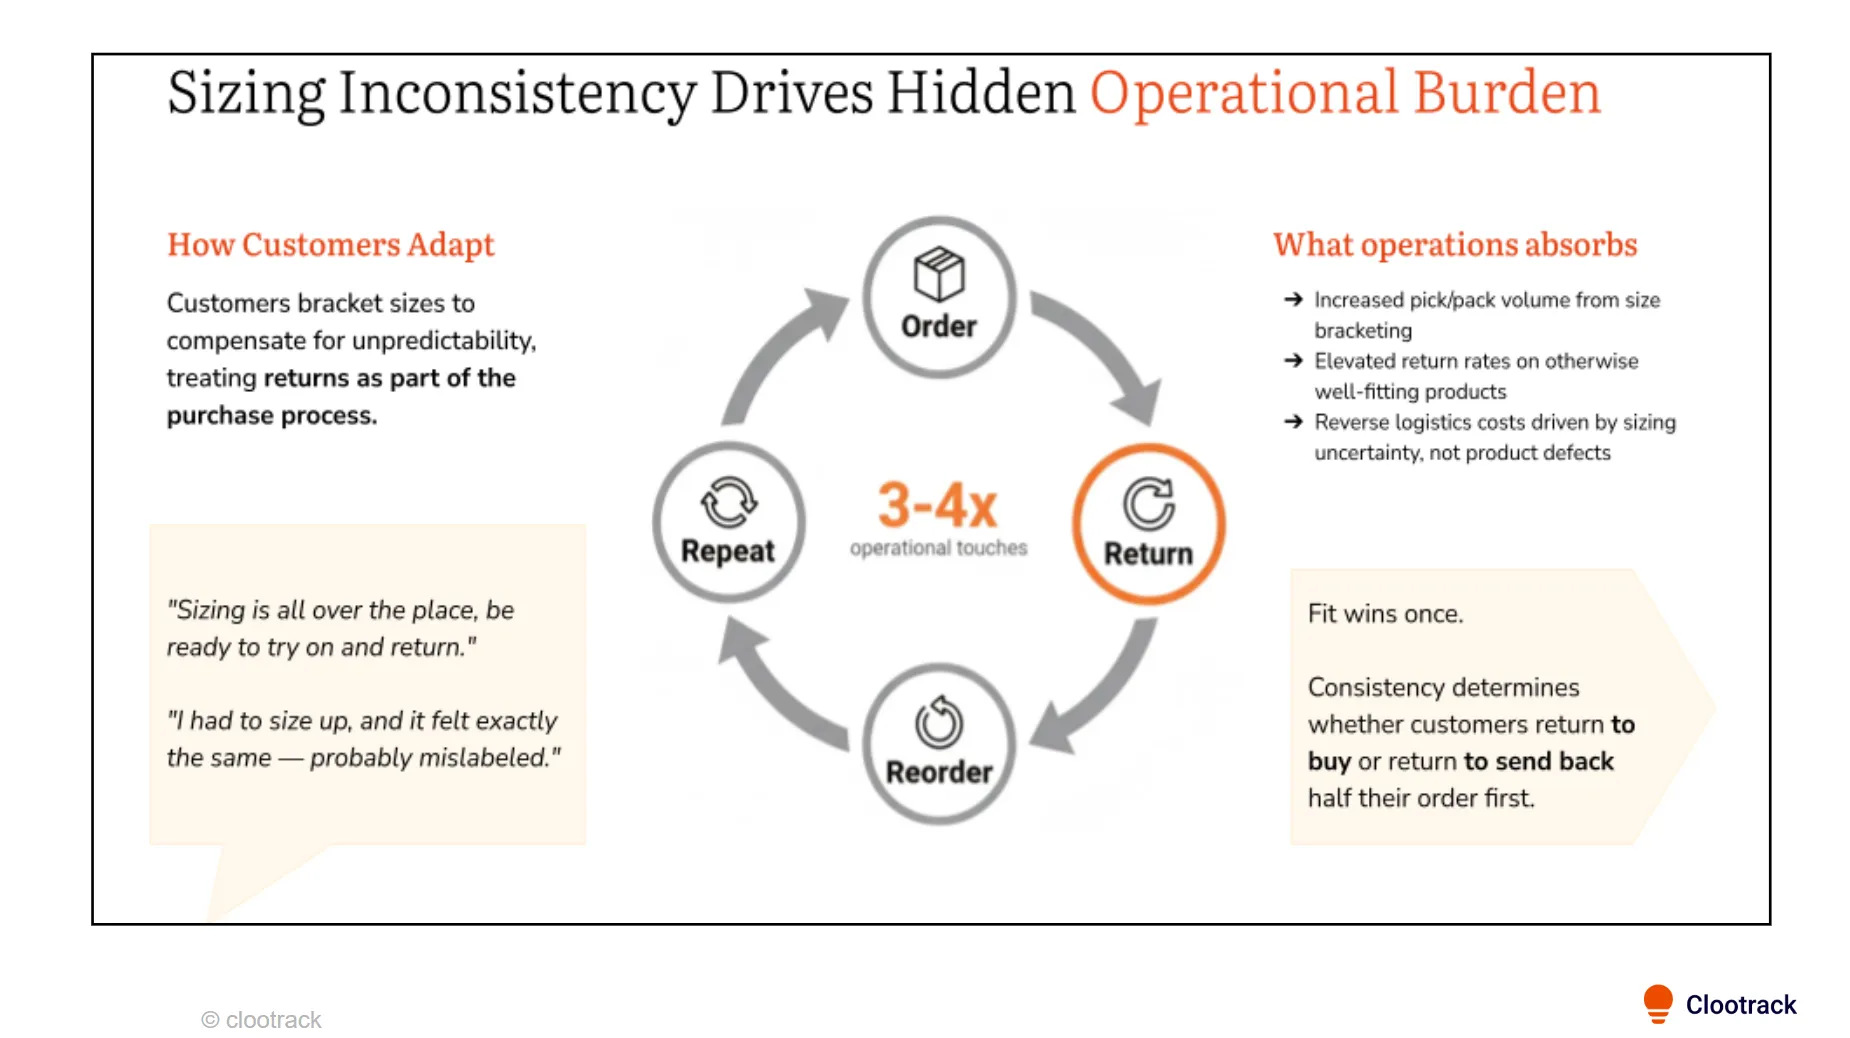
When sizing precision breaks, customer behavior changes before finance models catch up.
Customers begin to self-correct the brand’s uncertainty by ordering multiple sizes, treating returns as part of the purchase process. The analysis explicitly notes this bracketing behavior and the resulting operational burden.
That creates a predictable leakage chain:
Sizing inconsistency → size bracketing → more fulfillment touches → more returns and handling cost → more reverse logistics/rework → lower trust and repeat confidence
In many apparel return workflows, once bracketing becomes normal behavior, operations can absorb 3–4x more touches per successful purchase.
This is why “returns” should not be framed only as refund dollars. The actual leakage includes:
- additional warehouse handling,
- return intake and restocking effort,
- inventory quality degradation risk,
- higher support/contact load,
- and LTV erosion from customers who no longer trust reorder outcomes.
The broader implication is clear: the risk is not only losing customers from poor fit, but losing repeat-purchase confidence while paying operationally for customers to “self-correct” sizing issues.
How to quantify margin leakage with VoC analytics + returns operations data
To move from insight to action, VoC platforms have to become a measurement layer on top of returns and order operations data. The goal is not just to read complaints. It is to estimate the share of margin leakage caused by preventable variance.
1) Separate fit satisfaction from sizing reliability in your returns model
Do not collapse everything into a single “fit” bucket.
If fit sentiment is high while sizing sentiment is weak, the problem is usually consistency at scale (grading, tolerances, labeling, wash variation, channel execution), not core fit design. This pattern appears repeatedly in denim review analysis.
2) Attribute returns to variance types, not just reason codes
Traditional reason codes like “too small” or “poor quality” are too shallow for margin decisions. VoC helps split them into actionable variance classes, such as:
- Sizing variance (waist/length inconsistency, mislabeled sizes, wash-to-wash drift)
- Quality variance (construction inconsistency, durability gaps, delivery condition)
- PDP accuracy variance (description/image mismatch, expectation-setting failures)
The analysis also flags severe post-purchase pain in Returns & Exchanges (17.9% positive) and Product Delivery Condition (17.2% positive), reinforcing that leakage is not just a pre-purchase sizing issue.
3) Build a variance-linked leakage formula for high-volume SKUs
A practical starting point:
Margin leakage = (avoidable return cost × VoC-attributed variance share) + incremental handling burden + repeat purchase erosion risk
You do not need a perfect model on day one. Start by estimating leakage on high-volume styles where variance is concentrated.
Where to prioritize first for the fastest ROI in returns reduction

A good VoC analytics returns strategy does not begin everywhere. It begins where leakage is concentrated.
Clootrack VoC denim analysis points to specific hotspots:
- mid-price ranges ($50–$100),
- Straight Fit and Regular Fit,
- and core-volume segments where variability creates both customer frustration and operational cost.
That is the right place to start because these SKUs sit at the intersection of:
- high volume,
- repeat purchase potential,
- and high cost amplification when sizing/quality variance appears.
In other words, this is where VoC-driven returns analysis moves from “interesting insight” to “margin recovery program.”
The strategic takeaway for retail VoC and returns analytics
If the goal is to reduce margin leakage from returns, the bottleneck is usually not visibility; it is root-cause speed. Most teams can see return rates. What slows action is attribution: which drivers are creating the returns, and which of those are worth fixing first based on margin impact.
This is where Clootrack’s AI Returns Agent fits in more directly than a standard VoC dashboard.
Watch Demo → VoC Analytics Returns Agent
Clootrack’s Returns Agent helps retail teams cut ecommerce returns by 9%–18% by fixing root-cause drivers, which is exactly the right approach when margin leakage is coming from sizing and quality variance, not just return volume.
Built for returns analysis (not generic sentiment reporting), our Returns Agent brings together return reason codes, reviews, call logs, tickets, and logistics data in one workflow and enriches records with SKU, customer, and operations metadata. That allows your team to trace broad labels like “too small” or “poor quality” back to the actual failure pattern, such as fit/sizing issues, quality defects, packaging failures, delivery damage, or expectation gaps.
The value is in how it supports action. Our Returns Agent identifies high-risk SKUs and variants, distinguishes preventable returns (content, packaging, process, expectation-setting) from structural product issues (design/material flaws), and ranks fixes by return-reduction potential and profitability impact. This gives your merchandising, product, and operations teams a clearer order of execution instead of reacting to complaint volume alone.
FAQs
1) What is margin analysis in retail?
Margin analysis in retail is the process of identifying where profit is being earned and where it is being lost.
It helps retailers understand how returns, discounts, damaged inventory, shipping costs, and fulfillment issues affect profitability across products, categories, and channels. For returns-focused teams, margin analysis is useful because a product may look profitable in sales reports but still lose margin after return processing, reverse logistics, and markdown losses.
2) What is a margin analysis example in retail?
A margin analysis example in retail is comparing a product’s expected profit with its actual profit after return-related costs. Example: a product sells well and appears healthy on gross margin, but frequent returns due to sizing issues reduce the real margin after shipping, restocking, and resale loss. This helps teams see the difference between:
- reported margin,
- true margin after returns and operational costs.
3) How do you quantify margin leakage from sizing and quality variance in retail returns?
To quantify margin leakage, calculate how much return-related loss is caused by repeat sizing issues, quality defects, and expectation gaps.
A simple process:
- Group returns by root cause (sizing, quality, damage, PDP mismatch, etc.).
- Add return-related costs per unit (shipping, handling, restocking, support, markdown risk).
- Estimate which returns were preventable.
- Measure leakage by cause to identify the biggest margin drain.
This helps retailers move beyond return rate reporting and focus on avoidable profit loss.
4) What is the average retail return rate in 2026?
Average retail return rates vary by category and channel, with apparel and ecommerce typically higher than store-led categories. The more useful metric is not just the average return rate, but what is driving your returns:
- sizing inconsistency,
- product quality issues,
- delivery damage,
- or product description mismatch.
Even a “normal” return rate can hide major margin leakage if preventable causes keep repeating.
5) Why are sizing issues a top cause of retail returns?
Sizing issues are a top cause of retail returns because customers buy for fit, not just for product style. When customers lose confidence in sizing, they often order multiple sizes (bracketing), return part of the order, or avoid repeat purchases, directly increasing margin leakage. Returns increase when there is:
- inconsistent sizing across products or washes,
- unclear size charts,
- weak fit guidance,
- or a mismatch between product content and actual fit.
6) How do you calculate the financial cost of retail returns?
The financial cost of retail returns includes more than the refund amount. In simple terms: Total return cost = refund impact + handling cost + recovery loss + service cost. This gives a more accurate view of return-driven profit loss. A practical returns cost calculation should include:
- refund value,
- return shipping cost,
- inspection and restocking cost,
- customer support cost,
- markdown or inventory recovery loss,
- repeat purchase risk (if customer trust drops).
7) What are common VoC survey questions for retail returns?
Common VoC survey questions for retail returns help identify why a return happened, not just what was returned. Here are some top returns survey questions:
- What was the main reason for the return?
- Was the size/fit as expected?
- Did the product match the photos and description?
- Was there any quality issue or damage?
- How easy was the return process?
- Would you buy this product again?
- What could have prevented this return?
These questions help separate sizing, quality, content, delivery, and process-related issues.
8) How do returns policies affect retail profit margins?
Returns policies affect retail profit margins by influencing both conversion and return volume.
A customer-friendly policy can improve purchase confidence and conversion. But if sizing or quality issues are unresolved, it can also increase avoidable return costs. A stricter policy may reduce some returns, but it can also hurt customer trust and reduce sales. A strong’ strategy is:
- a clear, customer-friendly returns policy,
- Plus root-cause fixes that reduce preventable returns.
9) What is an AI returns agent for retail VoC analytics?
An AI returns agent for retail VoC analytics is an agentic system that identifies the real drivers of returns by analyzing customer feedback and return data together. Clootrack’s Returns Agent helps in faster prioritization and better action to reduce avoidable return-driven margin leakage. It connects holistic signals from return reasons, reviews, support tickets, call logs, and logistics data, and helps retailers identify root causes such as sizing inconsistency, product defects, delivery damage, packaging failures, and expectation mismatches.
Share :
Do you know what your customers really want?
Analyze customer reviews and automate market research with the fastest AI-powered customer intelligence tool.