What is a statistically valid survey response rate?
Last Updated:
September 3, 2025
Reading time:
Time
mins
In CX programs, the real question isn’t ‘How many replied?’ — it’s ‘Do these replies represent my customers as a whole?’
In 2025, a statistically valid survey response rate means collecting enough balanced responses to keep your margin of error low and your confidence level high (typically ±5% at 95%).
1. Statistical validity in plain terms
In CX programs, statistical validity is your safeguard against making big calls based on a skewed sample. It depends on three factors:
Sample size – How many completed surveys you collect.
Population size – The total number of customers invited.
Confidence level and margin of error – How certain you want to be, and how much result variation you’ll tolerate.
For most customer surveys:
95% confidence with a ±5% margin of error is the standard.
That means if the survey says 70% of customers are satisfied, the “true” number in the population is very likely between 65% and 75%.
Customer survey sample size is king, not just rate
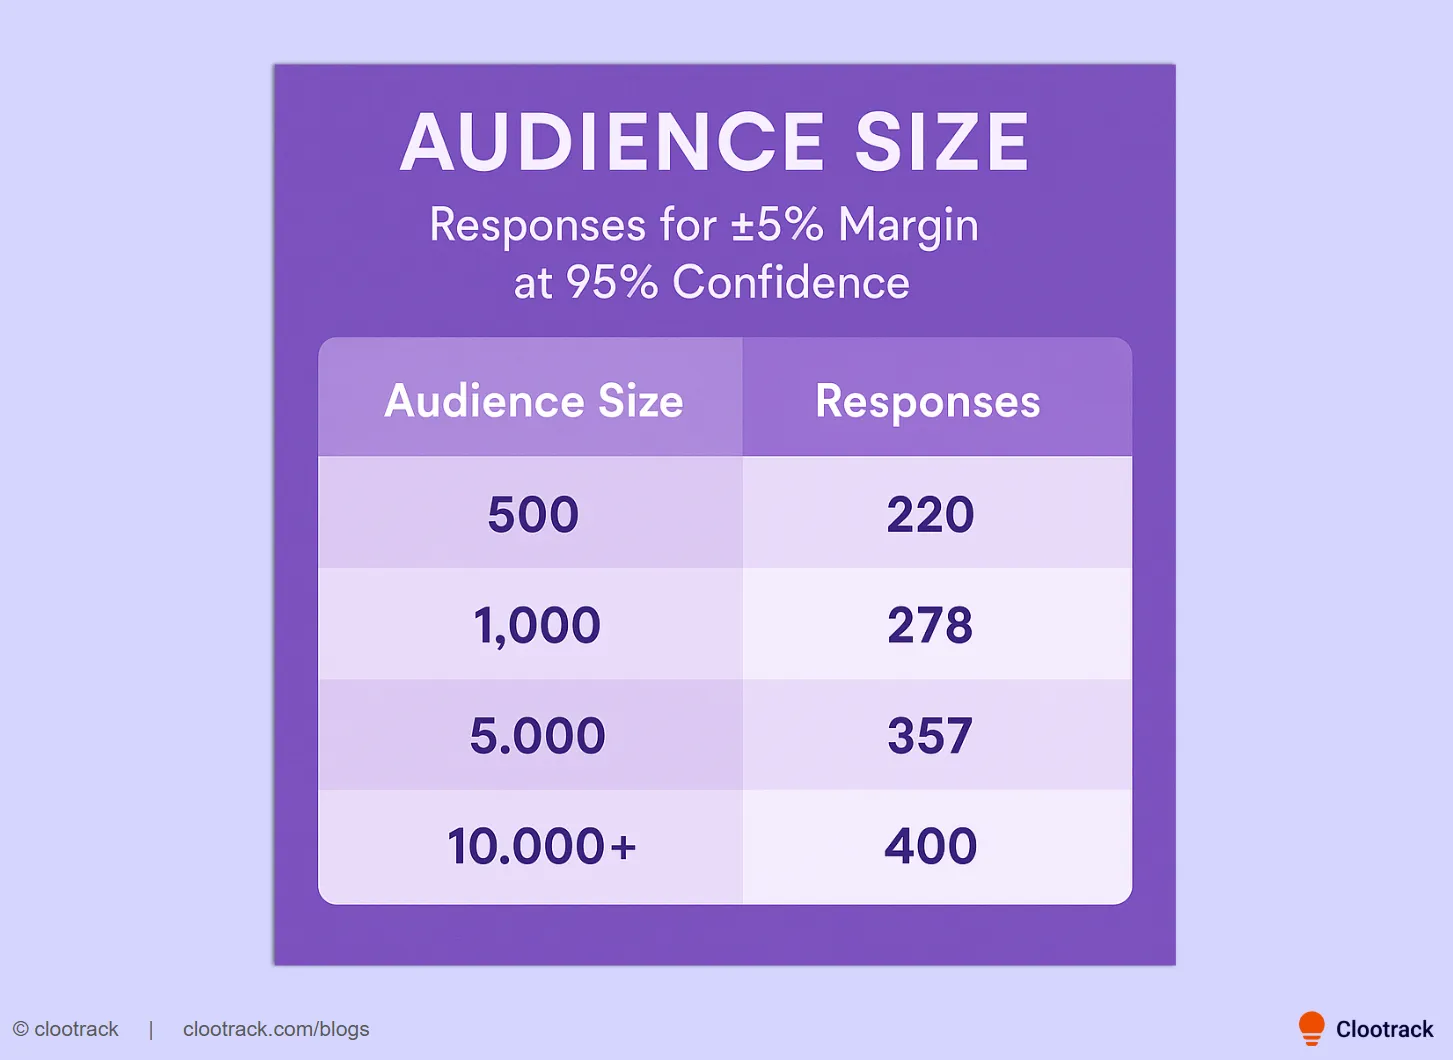
Rather than chasing a percentage, focus on the absolute number of responses needed:
Around 385–400 responses is standard for large samples (10,000+), to achieve ±5% margin at 95% confidence.
Even a high 30% response rate means little if your sample lacks depth or diversity.
Conversely, a modest 6% rate can still be valid if the sample is well-segmented and representative.
2. How many responses do you really need?
Key insight: It’s the number of completed surveys that determines validity, not the percentage. Example:
400 responses from 10,000 customers (4% rate) can be as statistically valid as 400 from 1,000 customers (40% rate), if both are balanced across key segments.
3. The CX risk of chasing “high” response rates
A 35% response rate sounds impressive, until you realize it’s dominated by loyal promoters and excludes silent detractors. Likewise, a 6% rate might be enough for valid insights if your sample reflects:
Different spending levels.
Mix of promoters, passives, and detractors.
Geographic and product-line diversity.
In other words, representation > raw percentage.
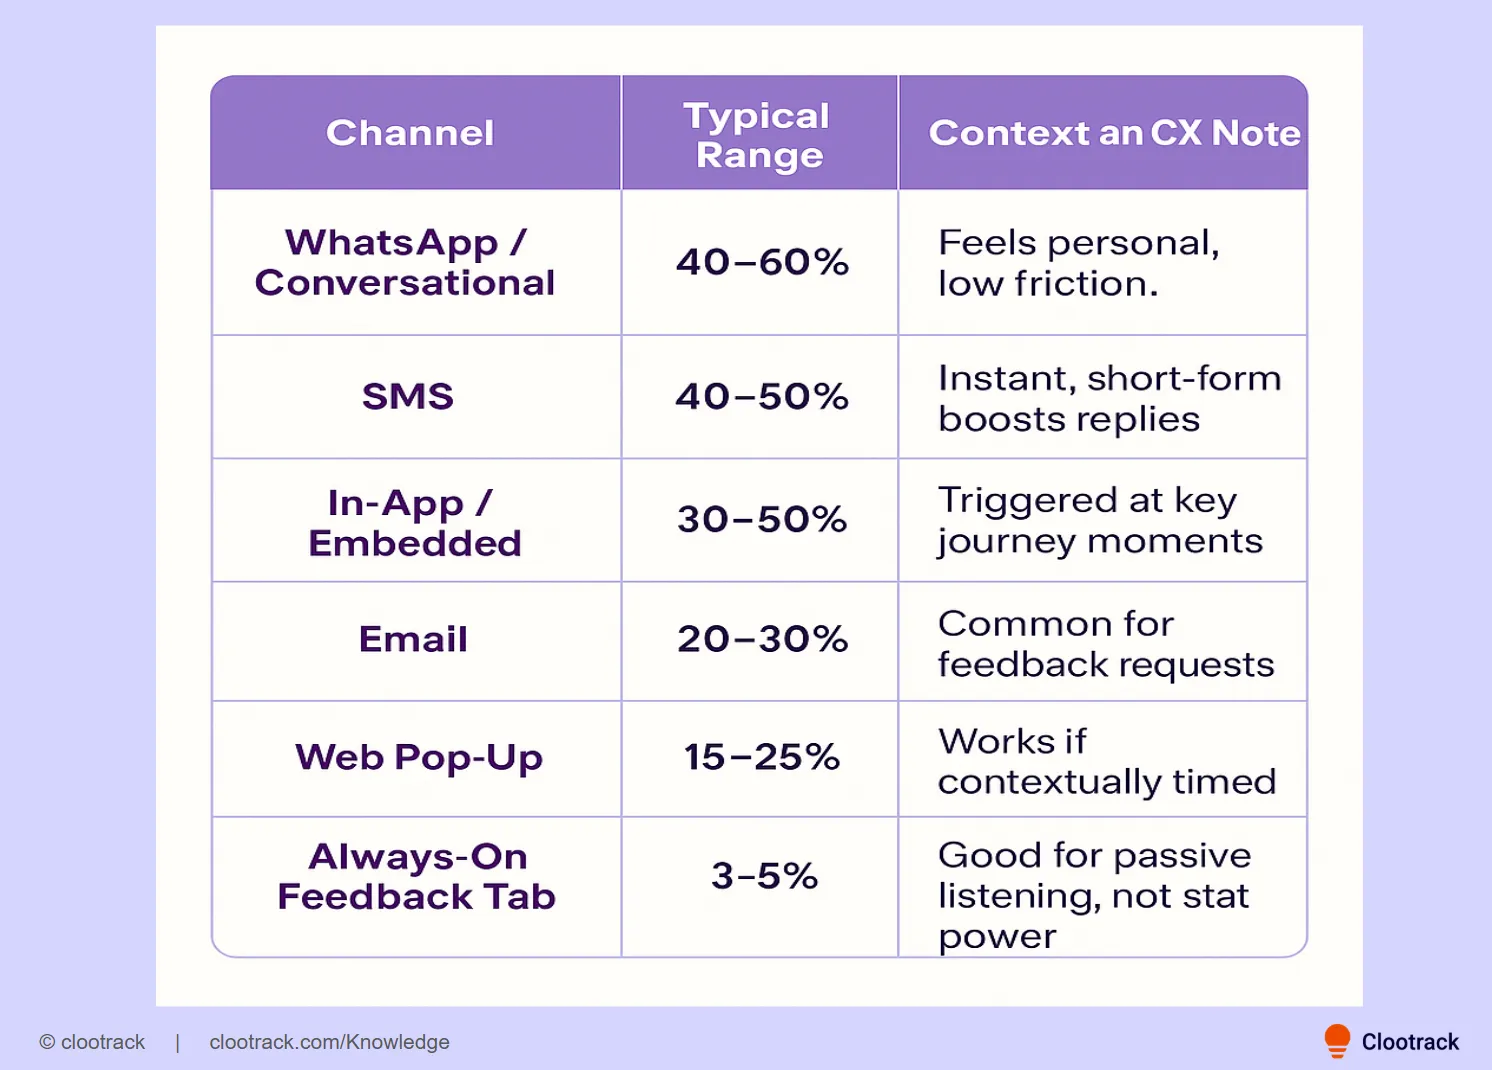
4. Survey response rate benchmarks by channel
2025 industry benchmarks show just how much delivery channel changes the game:
20–25% is the typical digital CX range, a 15–30% survey response rate is acceptable, and >30% is exceptional, especially when tied to timing, personalization, and targeted outreach.
Incentives- Use Cautiously: While they can spike response rates, sometimes by 20–30%, they also risk biasing the sample.
Close the loop – Share changes you’ve made from feedback (“You said, we did”) to build future participation.
6. Why survey response rate matters for CX success
A statistically valid response rate is less about hitting a fixed percentage and more about ensuring you capture enough responses, from the right customer mix, to act with confidence. Here’s why it matters for CX:
KPI accuracy: Valid response rates ensure that core CX metrics like NPS, CSAT, and CES reflect reality, not just the loudest voices. Without this, leadership may chase misleading trends.
Churn reduction: Low or skewed response rates can hide at-risk segments. By ensuring validity, organizations surface churn drivers early and take corrective action before attrition hits.
Retention strategies: Reliable survey data informs strategies that actually move the needle—whether improving onboarding, product adoption, or customer support experience.
Revenue protection: A statistically valid response rate helps tie CX actions directly to financial outcomes such as reduced churn, longer customer lifetime value, and improved repeat purchase rates.
Channel mix advantage: Leveraging SMS or in-app prompts can accelerate valid data collection, strengthening the link between CX programs and measurable business impact.
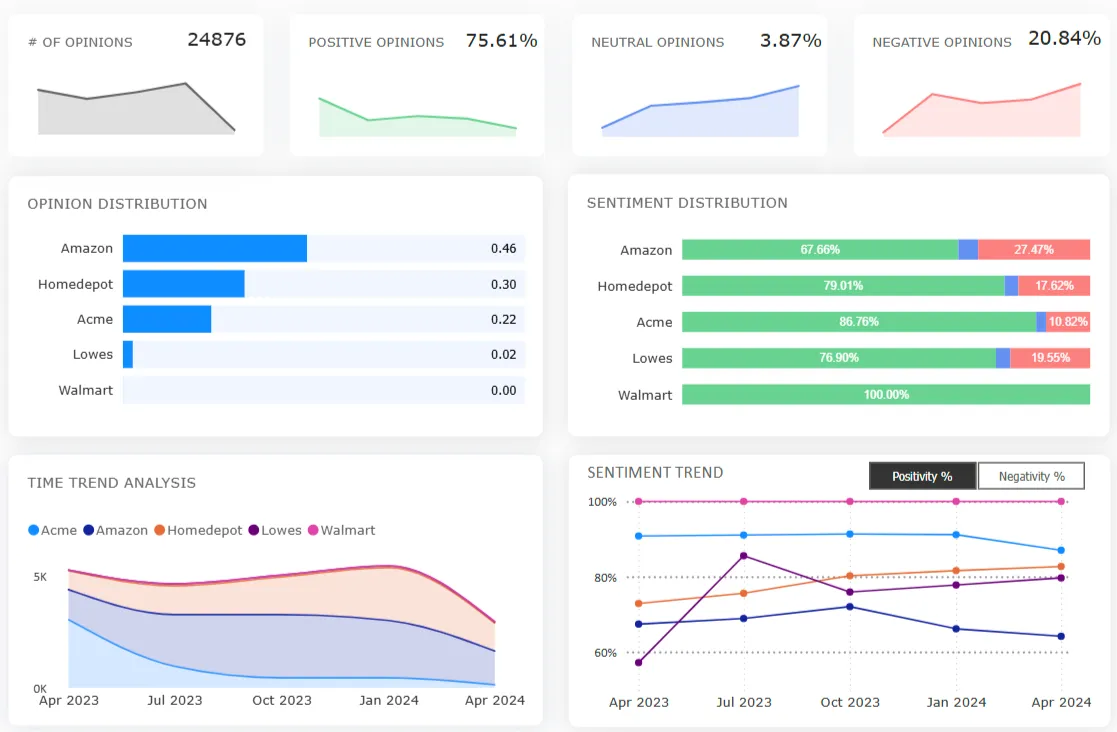
Clootrack feedback analytics edge
For companies running enterprise-scale CX programs, a statistically valid survey response rate is not about vanity; it’s about protecting decision quality.
Don’t chase a number for bragging rights. Aim for a response set that’s big enough, balanced enough, and representative enough to guide confident, high-stakes CX decisions.
With Clootrack’s multi-source VoC analysis, you can:
Blend survey results with call transcripts, reviews, and chat logs
Detect representation gaps before they bias your data
Weight and adjust for underrepresented segments
This way, even if survey participation dips, your insights remain robust and representative.