🎉 Clootrack recognized by OpenAI for crossing 100 billion tokens in Voice of the Customer analytics →
Read the story


In survey-driven business strategies, response rate is one of the clearest indicators of engagement and data reliability. For leaders in CX, product, and insights, knowing what qualifies as a good response rate is essential to interpreting feedback and making informed decisions. Yet, the definition of "good" is context-dependent and often misunderstood.
Accepted survey response rate benchmarks for 2025 help leaders calibrate feedback efforts against signal reliability and audience engagement. Deviation from standard ranges often reflects differences in respondent motivation, survey timing, or channel effectiveness—factors that can be more critical than volume alone when assessing insight validity.
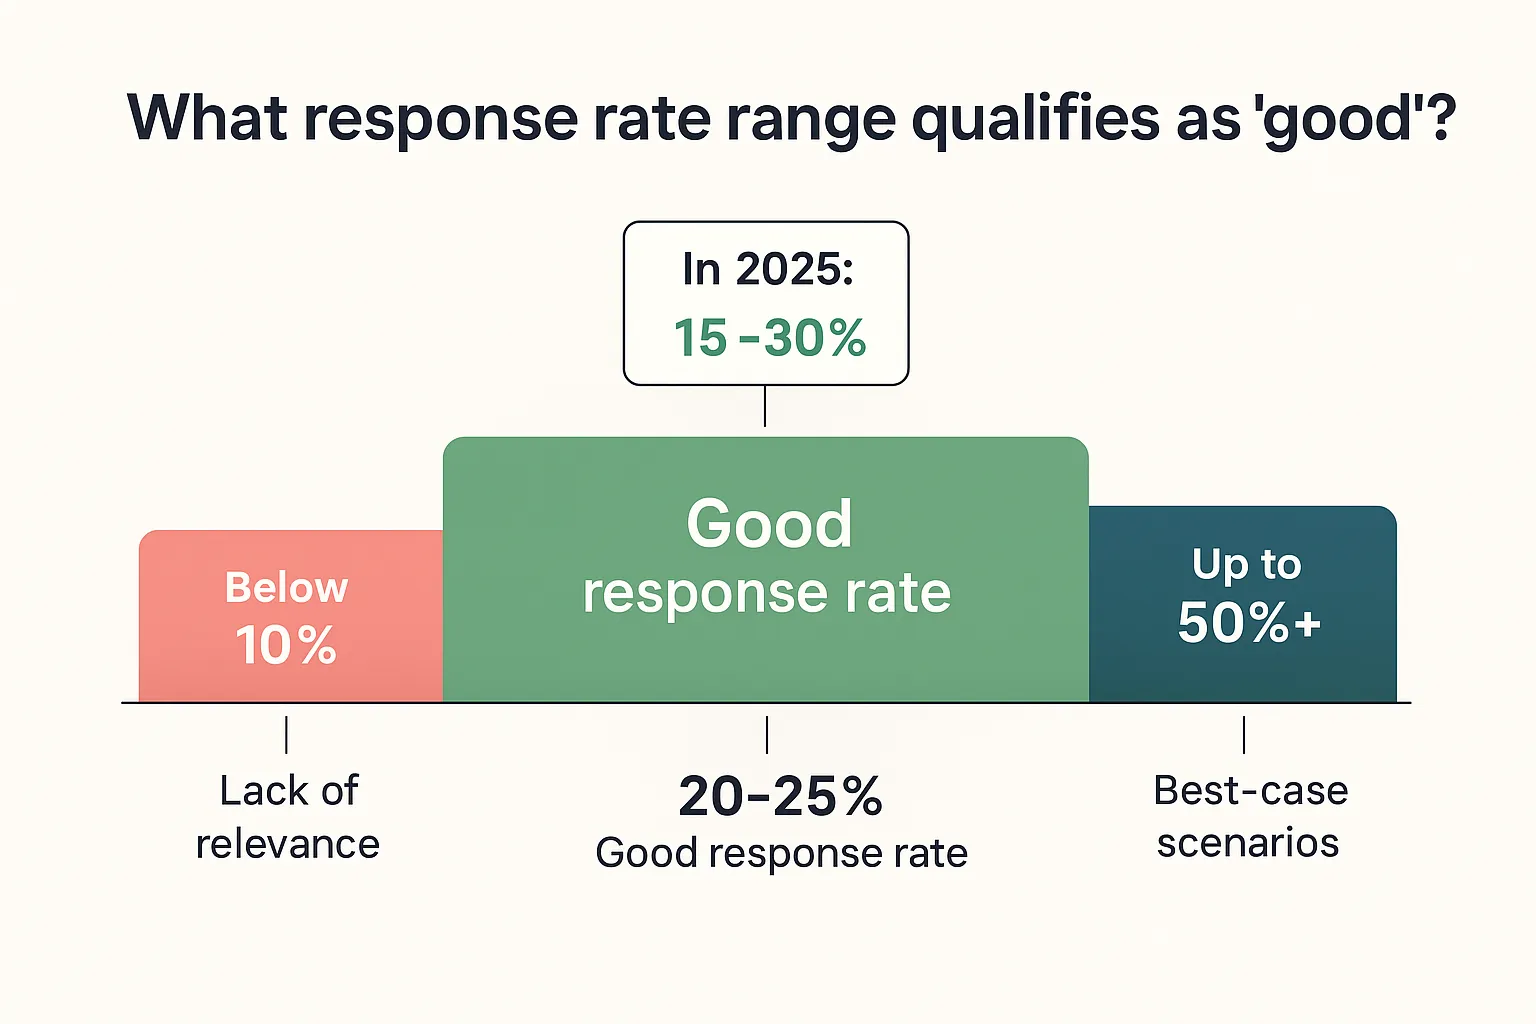
A good survey response rate in 2025 typically falls between 15% and 30%, with most email, web, and in-app surveys averaging 20% to 25%. This range reflects the industry standard for survey response rates and balances reach, participant motivation, and survey fatigue.
While 30%+ survey response rates are possible, they are exceptions driven by:
📌Post-event surveys, B2B account-based follow-ups, and SMS interactions tied to service moments can exceed 40%, even hitting 50%+ when timing, trust, and relevance align.
In contrast, a survey return rate under 10%, common in online survey response rates from over-surveyed audiences, often points to lack of relevance, poor targeting, or low respondent motivation. In some segments, rates can fall below 5%, making insights unreliable for decision-making.
This benchmark isn’t arbitrary. Leading market research firms consistently show that survey response rates between 15% and 30% deliver directionally valid insights without relying on excessive incentives or follow-ups.
Importantly, a good response rate alone doesn’t guarantee accuracy. A well-structured questionnaire response rate at 20% can still be statistically valid, if the sampling is controlled.
Leaders should prioritize representativeness over raw volume.
High survey response rates are possible, but only when surveys are embedded in the customer’s natural journey and context.
Instead of general outreach, these scenarios focus on hyper-targeted moments where response is frictionless:
These formats don’t succeed just because of the channel—they work because relevance, timing, and trust converge.
For leaders, the takeaway is not to raise benchmark expectations, but to replicate the intent-match seen in these scenarios wherever possible.
In certain cases, yes. An acceptable survey response rate under 5% can still offer directional insights if:
However, in most industries, especially B2C, a low survey response rate significantly increases decision risk, reduces feedback reliability, and signals the need to reassess your survey participation strategy, targeting, and channel mix.
No. While a high survey response rate often feels like a success metric, it doesn’t automatically ensure that results are accurate or representative.
Studies in 2025 show that non-response bias and sampling error can persist even when response rates exceed 50%. High participation doesn’t eliminate:
Executives should view response rate as one quality signal, not the only one. To validate data integrity, teams should also:
A good survey response rate typically ranges from 15% to 30%, with 20–25% emerging as the norm in most digital CX and product feedback programs. Rates under 10% suggest limited engagement, while those above 30% reflect exceptional context or targeting.
The right response rate is one that balances reach, signal quality, and decision confidence.
If you're seeing declining response rates or struggling to meet benchmarks, explore how Clootrack helps brands overcome the survey response rate challenge with AI-powered feedback alternatives and contextual insight generation.
Benchmarks vary by format. Email survey response rates in B2C typically average 20–30%, while B2B NPS benchmarks hover around 12–15%. SMS and in-app survey response rates can reach 40%+ due to immediacy.
Acceptable rates depend on context. For general online survey response rates, 15–25% is considered reliable. Below 10% often lacks statistical power unless purpose-built for qualitative exploration.
Employee survey response rate benchmarks typically range from 30% to 60%, depending on trust and anonymity. Customer survey response rates usually range from 20% to 30% depending on survey type, channel, and perceived value.
For high-stakes decisions, a good response rate is one that achieves demographic parity and covers key segments, usually in the 20%+ range with verified sample structure. Leaders must ensure data relevance more than raw percentage.
Response rate tracking requires clarity in definitions:
Automated tracking dashboards help maintain consistency, especially across multichannel survey programs.
Share :
Analyze customer reviews and automate market research with the fastest AI-powered customer intelligence tool.