Retail category winners and losers in GLP-1 households: A VoC analytics perspective

Last Updated:
April 22, 2026

Reading time:
Time
mins

GLP-1 adoption is not producing uniform retail demand decline. It is producing category-level redistribution: specific categories accelerating, specific categories decelerating, and specific categories shifting in format rather than volume.
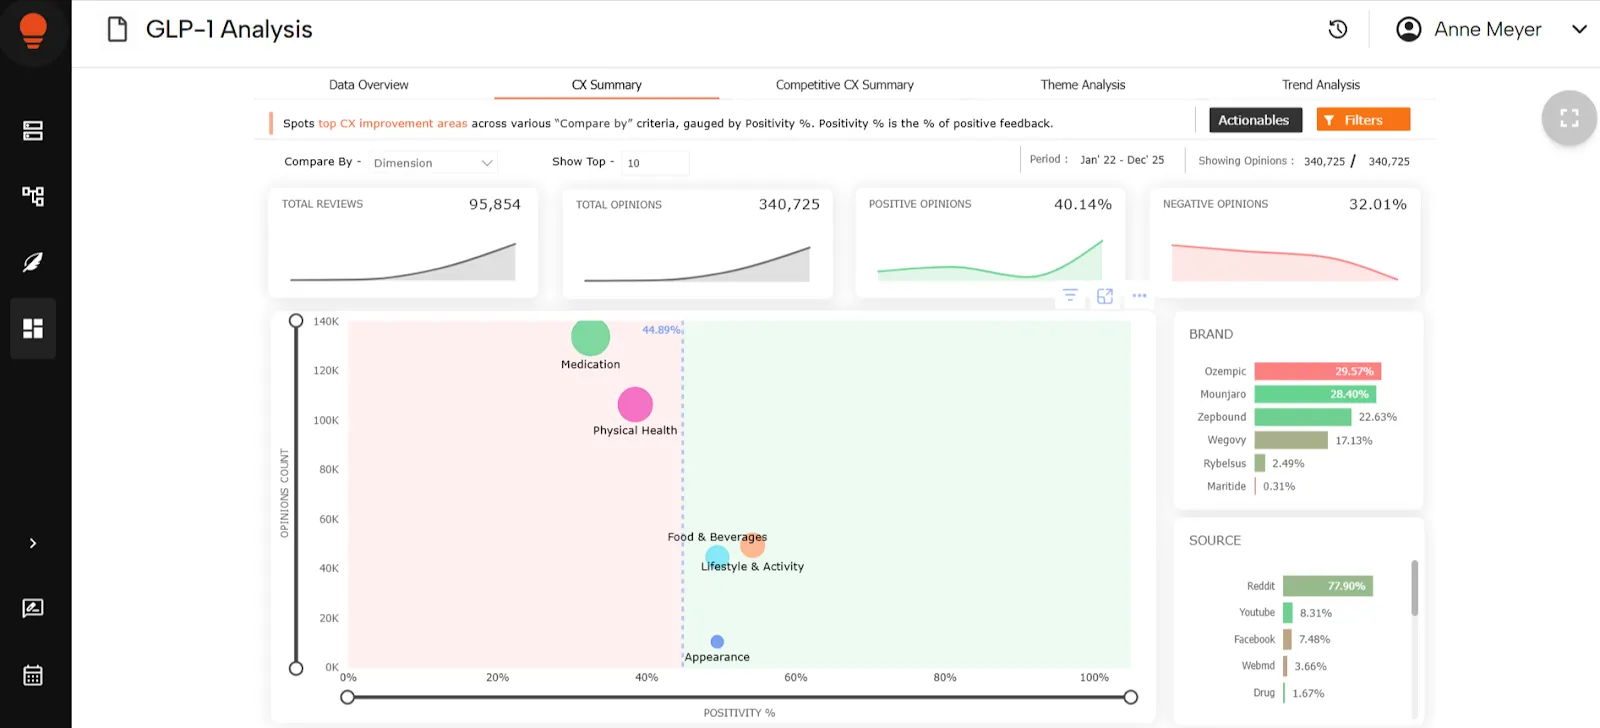
This knowledge base maps which retail categories are winning, which are losing, and which are shifting based on Clootrack's analysis of 95,854 GLP-1 consumer conversations collected between January 2022 and December 2025. It is a reference map for category leaders and commercial planners who need to know where demand is moving before it confirms in transaction data.
TL;DR
- GLP-1 households are not spending less. They are redirecting spend toward health maintenance categories and away from discretionary categories
- Winning categories: hydration, protein foods, walking gear, GI management products, collagen and firming skincare, produce and whole foods
- Losing categories: alcohol (physiological shift, not discretionary), takeout, impulse purchases, decorative cosmetics
- Shifting categories: apparel (format shift toward flexible fit and accessories), fitness (from performance to preservation), beauty (from aspiration to repair)
- The sequencing matters: defensive health spending is funded first, expressive discretionary spending recovers later
The reference framework: Winners, losers, and shifters
GLP-1 category performance splits into three groups. Each requires a different commercial response.
- Winners are categories experiencing accelerating demand driven by GLP-1-specific behavioral needs. Growth is structural and recurring, not promotional.
- Losers are categories experiencing structural demand reduction. Some losses are physiological and will not respond to promotional intervention. Others are discretionary and may recover as spending priorities settle.
- Shifters are categories where total demand is not declining but the format, motivation, or product type within the category is changing. Retailers who merchandise for the old format miss the new demand even within the same category.
Winning categories
1. Hydration products
Hydration Practices: 1,378 mentions, 62.4% positive sentiment, 99.3% MoM growth. Hydration has become a core weekly management behavior for GLP-1 users managing injection-related GI effects. Growth is pharmaceutical-schedule driven and restocks weekly regardless of promotional activity.
2. Protein foods
Protein Foods: 2,866 mentions, 57.5% positive sentiment, 66.2% MoM growth. Protein demand is driven by muscle preservation anxiety, the concern that rapid weight loss is depleting muscle alongside fat. This is not aspirational nutrition demand. It is maintenance-driven and recurring.
3. GI management products
Side Effects Management and Coping: 1,106 mentions, 57.9% positive sentiment, 43.4% MoM growth. OTC GI relief, ginger-based products, and electrolyte solutions are being assembled as weekly management regimens. Demand is biologically scheduled and promotion-independent.
4. Produce and whole foods
Produce and Whole Foods: 1,611 mentions, 69.2% positive sentiment, 86.6% MoM growth. GLP-1 households actively managing food quality and nutritional density show strong positive sentiment toward whole food categories. This is defensive health spending, funded before discretionary categories.
5. Firming and repair skincare
Cosmetic Interventions: 162 mentions, 71.6% positive sentiment, 927.8% MoM growth. Non-surgical corrective skincare (firming serums, collagen supplements, red light therapy devices) is the fastest-growing category signal in the appearance dataset. Growth is driven by facial deflation anxiety, not celebration.
6. Walking and entry-level fitness gear
Walking Routines: 1,193 mentions, 78.4% positive sentiment, 41.2% MoM growth. Walking is the dominant activity signal because it requires no performance threshold. Entry-level footwear, walking accessories, and step-tracking devices sit in the same demand cluster.
Losing categories
1. Alcohol
Alcohol Tolerance: 206 mentions, 32.5% positive sentiment, 331.7% MoM growth. Alcohol Sensitivity: 160 mentions, 14.4% positive sentiment, 291.8% MoM growth. A significant portion of the alcohol demand shift is physiological. GLP-1 users describe changed tolerance and sensitivity as biological effects rather than deliberate choices. Physiological demand loss does not respond to promotional intervention. This distinguishes it from voluntary reducers who may respond to non-alcoholic alternatives.
2. Takeout and discretionary food services
Consumer language explicitly names takeout, dining out, and food delivery services as categories being defunded to offset medication costs. Financial Trade-offs and Sacrifices: 291 mentions, 34.7% positive sentiment, 92.3% MoM growth. The exit is deliberate and budget-driven.
3. Decorative and aspirational cosmetics
As beauty spend reallocates from aspiration to repair, decorative cosmetics (makeup, fragrance, embellishment products) face reduced priority. The Appearance positivity trajectory declined from above 85% in 2022 to approximately 43% by 2024, with partial recovery to 51% by late 2025 reflecting the repair economy forming rather than aspiration returning.
Shifting categories
1. Apparel: format shift, not demand exit
Total apparel desire is present. New Clothing Purchases shows 74.2% positive sentiment. But Purchase Frequency sits at 0% MoM growth. The format shift is toward flexible fit designs, accessories, and footwear (78.3% positive sentiment) rather than full wardrobe replacement. Identity lag suppresses conversion during active weight loss. Fashion Confidence at 218.9% MoM growth signals recovery is forming.
2. Fitness: aspiration to preservation
Physical Activity maintains 63.1% positive sentiment across 15,112 mentions. The category is not declining. It is shifting from performance and transformation motivation toward maintenance and preservation motivation. Entry-level walking gear and wearables as validation tools are gaining share within the category at the expense of high-intensity performance equipment.
3. Beauty: aspiration to repair
Beauty spend is not leaving the category. It is reallocating within it, away from decoration and toward structural skin management systems. Retailers who merchandise beauty as aspiration are serving a motivation that a growing share of GLP-1 consumers has moved past.
For the full mechanism analysis behind each shifting category, see what is GLP-1 retail impact.
The sequencing rule
Understanding which categories win and lose is not sufficient without understanding the sequence in which budget reorganization occurs.
Defensive health spending is funded first. GI management, muscle preservation, hydration, and firming repair are immediate, recurring, and biologically driven. These categories are active now.
Expressive discretionary spending is deferred, not eliminated. Fashion-forward apparel, decorative cosmetics, and indulgent grocery categories face temporary suppression rather than permanent exit. The consumers who are not buying premium apparel today will return when weight stabilizes and identity confidence forms.
Retailers who position across defensive entry clusters capture immediate recurring demand. Retailers who maintain presence in deferred categories during the hesitation window are better positioned when expressive spending recovers.
For the full substitution flow analysis, see GLP-1 household spend reallocation.
FAQs
Which retail categories benefit most from GLP-1 adoption?
Hydration products, protein foods, GI management products, produce and whole foods, firming and repair skincare, and walking and entry-level fitness gear are the primary growth categories. All are driven by health maintenance and biological management needs rather than aspiration or promotion.
Which retail categories are most at risk from GLP-1 adoption?
Alcohol faces the most significant structural risk because a portion of the demand shift is physiological and will not respond to promotional intervention. Takeout, impulse purchases, and decorative cosmetics face deliberate budget reallocation as GLP-1 households redirect spend toward medication and health maintenance costs.
Is the decline in some categories permanent or temporary?
It depends on the mechanism. Physiological alcohol sensitivity changes are structural and may not reverse as consumers continue on medication. Discretionary cuts to takeout and impulse purchases may moderate as consumers adjust to medication costs. Apparel and beauty hesitation is temporary, both show recovery signals forming as weight stabilizes and identity confidence builds.
How does GLP-1 affect category margin performance?
Categories losing volume to GLP-1 behavioral shifts face margin pressure if promotional intervention is applied to a demand problem that is not price-sensitive. Discounting against physiological demand loss or psychological hesitation does not recover volume. It erodes margin without addressing the mechanism. Categories gaining volume from GLP-1 demand face a different challenge: the demand is system-level and distributed across aisles, making it difficult to capture at the individual SKU level.
How can retailers identify which GLP-1 category shifts are active in their market?
Voice of Customer analytics surfaces category-level formation signals through sentiment trajectory, volume growth, and cross-dimensional co-mention patterns before they stabilize into point-of-sale data. Retailers can compare intra-week basket composition, category velocity by day-of-week, and assortment performance in high-GLP-1-penetration markets against lower-penetration benchmarks to identify where the shift is most active.
Share :
Do you know what your customers really want?
Analyze customer reviews and automate market research with the fastest AI-powered customer intelligence tool.