🎉 Clootrack recognized by OpenAI for crossing 100 billion tokens in Voice of the Customer analytics →
Read the story


When your NPS survey response rate is strong (hits between 30–40% range), your customer loyalty metrics carry real weight. However, if only a few people respond, you risk obtaining a distorted view, which can make your Promoter and Detractor numbers misleading.
Achieving a strong NPS response rate isn’t just about statistics; it’s a competitive advantage. By securing broad and meaningful participation, your NPS reflects a wider spectrum of customer sentiment, not just the most eager voices, and helps you make confident, data-backed decisions.
In this guide, you’ll discover advanced, NPS-specific tactics, beyond general survey advice, to elevate response rates, preserve data integrity, and drive strategic loyalty gains.
With cross‑channel engagement varying dramatically (from as low as 3% to over 50% depending on context), these tactics empower you to rise above the noise through seamless interactivity and intelligent targeting.
Whether you're surveying individual consumers or organizational accounts, limiting feedback to one contact often misses critical insights. In B2C, include end users across usage types—frequent, occasional, and new, to reflect varied experiences. In B2B, extend outreach to real users, team leads, and decision-makers to capture both operational and strategic sentiment. Striving for 100% account coverage not only deepens insight into the customer experience, but it also flags disengaged or high-risk accounts via non-response, ensuring your NPS reflects the full picture.
Rigid surveys can drive users away. AI-powered approaches like active matrix factorization enable your survey to dynamically present only the most relevant follow-up questions for each respondent. This approach shortens the survey, preserves the richness of insight, and smoothens the experience, shortening effort while maximizing data value.
Static NPS survey formats can feel transactional and disengaging. In contrast, AI chatbots enable dynamic, conversational feedback, typically delivered within messaging apps or in-app interfaces, that adapt in real time to respondents’ answers. This conversational format reduces friction and encourages more expressive input, especially on mobile devices, without necessarily boosting overall survey response rates.
Two-frame NPS delivers clarity. Send one NPS prompt just before product usage (to capture expectations) and another after the experience (to capture performance). The gap between these scores reveals misalignments between perceived versus actual value, and uncovers areas for targeted CX improvement.
Timing is everything. Launch your NPS surveys outside of noisy periods like weekends, holidays, or major events when open rates often dip. Align outreach with quieter calendar moments, like mid-week mornings, to improve deliverability, open rates, and completion. This attention to external context elevates both reach and quality of participation.
While the classic 0–10 NPS scale remains essential, its slider format often underperforms, especially on mobile. Usability studies show that slider-based scales can increase response time, skew results, and reduce completion rates. In contrast, visual analog buttons or discrete, touch-friendly options (e.g., icon-based choices in follow-ups) offer better accuracy and speed on smartphones. Adopting these formats helps maintain response quality without compromising NPS integrity.
Reminders often feel repetitive. A better approach: embed subtle context-aware nudges, such as in-app alerts when a user logs in, or calendar-triggered taps tied to task completions. These reminders feel purposeful, timely, and considerate, encouraging voluntary completion without creating fatigue.
Primacy and recency biases can distort survey responses when options are consistently positioned first or last. To counteract this bias, randomize the order of follow-up question choices (such as list of reasons or service areas). However, do not randomize the fixed NPS 0–10 scale; its ordinal order is critical for consistency in scoring.
Research on pre-notification is mixed, while some studies show small gains in speed or initial awareness, others indicate minimal long-term impact on completion rates and potential added costs. Use a light, value-oriented heads-up, framed as helpful or informative, rather than a formal "required" ask. This preserves goodwill without inflating expectations.
Elevate NPS from metric to business strategy. Make response rate a performance indicator, for instance, tie completion goals to revenue segments and ensure prompt follow-up. Studies show programs that systematically close the loop with known customers improve retention and loyalty faster than those that don’t.
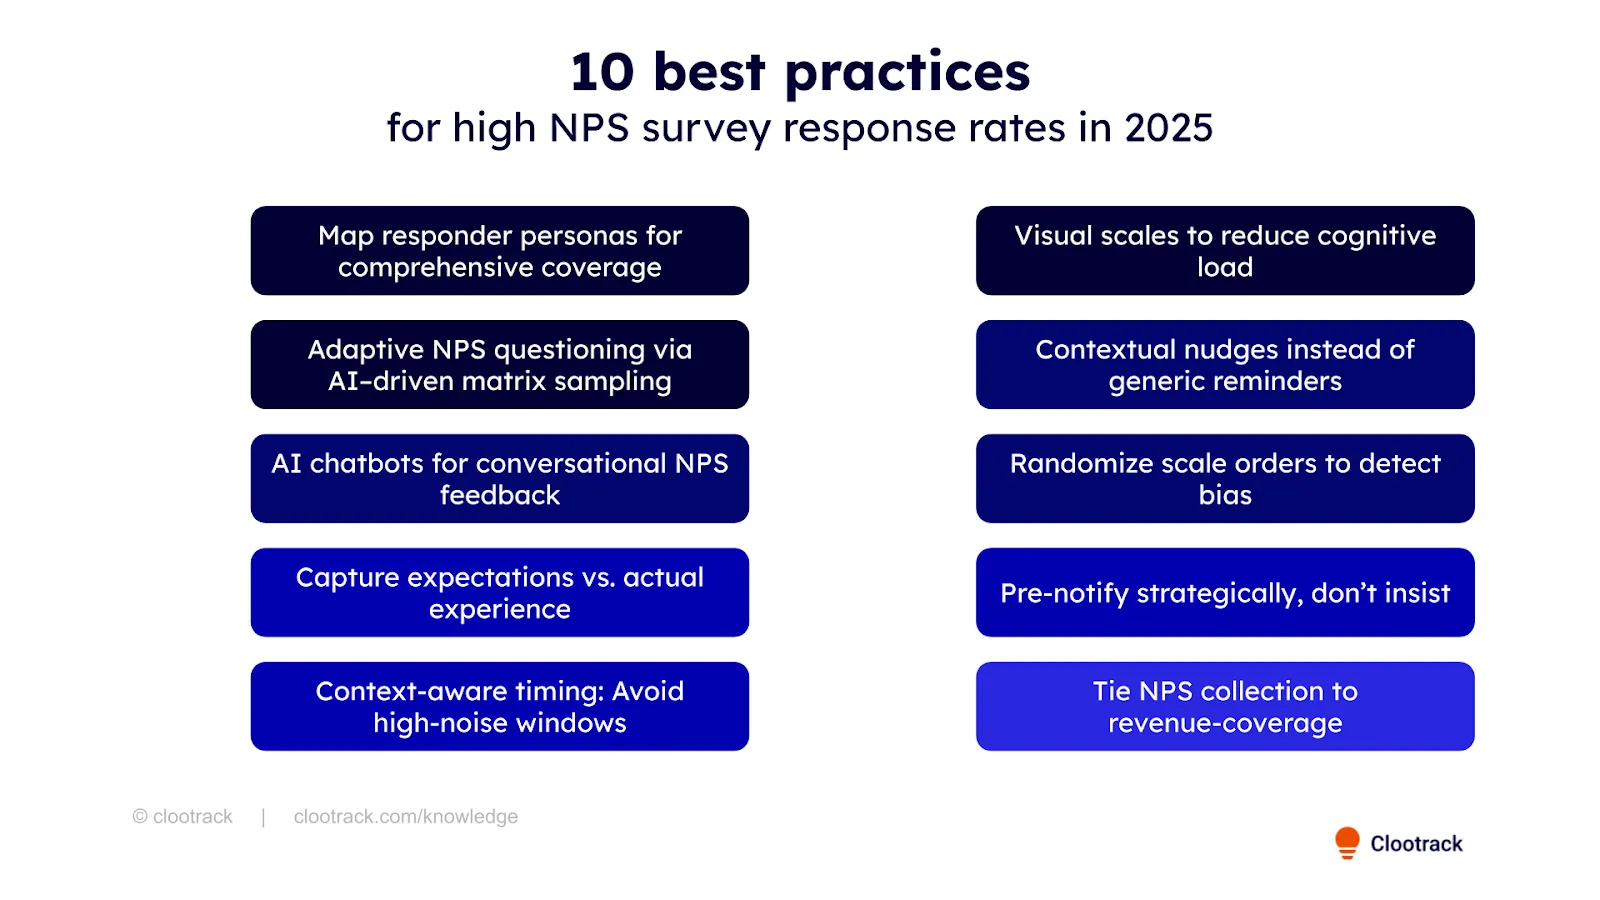
The tactics we’ve covered, whether it’s aligning outreach to responders, triggering surveys at emotionally resonant moments, using adaptive flows, or simplifying response formats, are about increasing the depth and clarity of your NPS signals. The goal isn’t just more responses, but more meaningful ones.
If you're looking for a seamless way to see how these strategies play out in practice, you can start a free trial of Clootrack. It’s an AI-led analytic platform trusted by global brands to unify customer feedback from multiple sources, surface thematic insights without manual tagging, and offer turnkey dashboards, all with zero heavy setup.
A strong NPS survey response rate in 2025 typically ranges from 30% to 40%, providing a reliable foundation for data-driven decisions. Falling consistently below 20% often indicates issues like poor timing, low relevance, or survey fatigue.
Low response rates raise two major issues:
Maintaining the right survey cadence is key:
Channel effectiveness varies widely based on context, convenience, and customer behavior:
The most effective programs use a layered approach, starting with email and reinforcing with SMS or in-app prompts, improving reach and completion.
Keeping your NPS survey short and focused is essential for strong engagement and meaningful feedback. The simplest and most effective structure includes:
This approach dominates best practices because:
Minimalist design, just two to three questions total delivers high response rates and high-value insights, especially when surveying busy or mobile-first audiences.
Share :
Analyze customer reviews and automate market research with the fastest AI-powered customer intelligence tool.