


Data-driven decision making is the practice of guiding business decisions with verified quantitative and qualitative evidence rather than intuition. It connects performance metrics with customer evidence to identify what changed, investigate why it changed, and determine which action is most likely to improve the outcome, starting from a defined decision with an accountable owner and a measured baseline.
Data-driven decision making (DDDM) is a management approach in which consequential business choices are framed, justified, and reviewed against evidence, so the organization can attribute outcomes to specific decisions and learn which ones worked.
Most enterprises already have more data than they use. Having data and deciding better with it are different capabilities, and the distance between them shows up as stalled initiatives, unexplained KPI swings, and AI spending without returns. Four related terms are often used interchangeably, but each plays a distinct role:
This guide covers the four analytics types, a five-step operating process, how Voice of Customer analytics closes the diagnostic gap between performance metrics and customer behavior, how each leader should act on the same finding, and how AI agents change governance. It draws on 2025 and 2026 research from Gartner, McKinsey, PwC, and Deloitte, plus Clootrack's own consumer conversation analysis.
It matters more because AI investment only pays back through the decisions it changes, and most organizations have not yet connected the two. PwC's 29th Global CEO Survey, published Jan. 19, 2026, from 4,454 CEOs in 95 countries surveyed Sept. 30 to Nov. 10, 2025, found that 56% have seen no significant financial benefit from AI and only 12% report both revenue and cost gains.
The finding that matters for decision makers sits underneath. CEOs reporting both gains were two to three times more likely to have embedded AI extensively across products and services, demand generation, and strategic decision-making. The finding suggests AI delivers more financial value when it is embedded in consequential business activities rather than treated as a standalone tool. For leaders, that makes the quality of the decisions AI changes as important as the technology itself.
The business implication is direct. When pricing, assortment, and product decisions keep running on habit, analytics and AI become a cost line with no attributable outcome. The first move is to list the 10 recurring decisions that most affect your P&L and confirm each has a named owner and a defined evidence base.
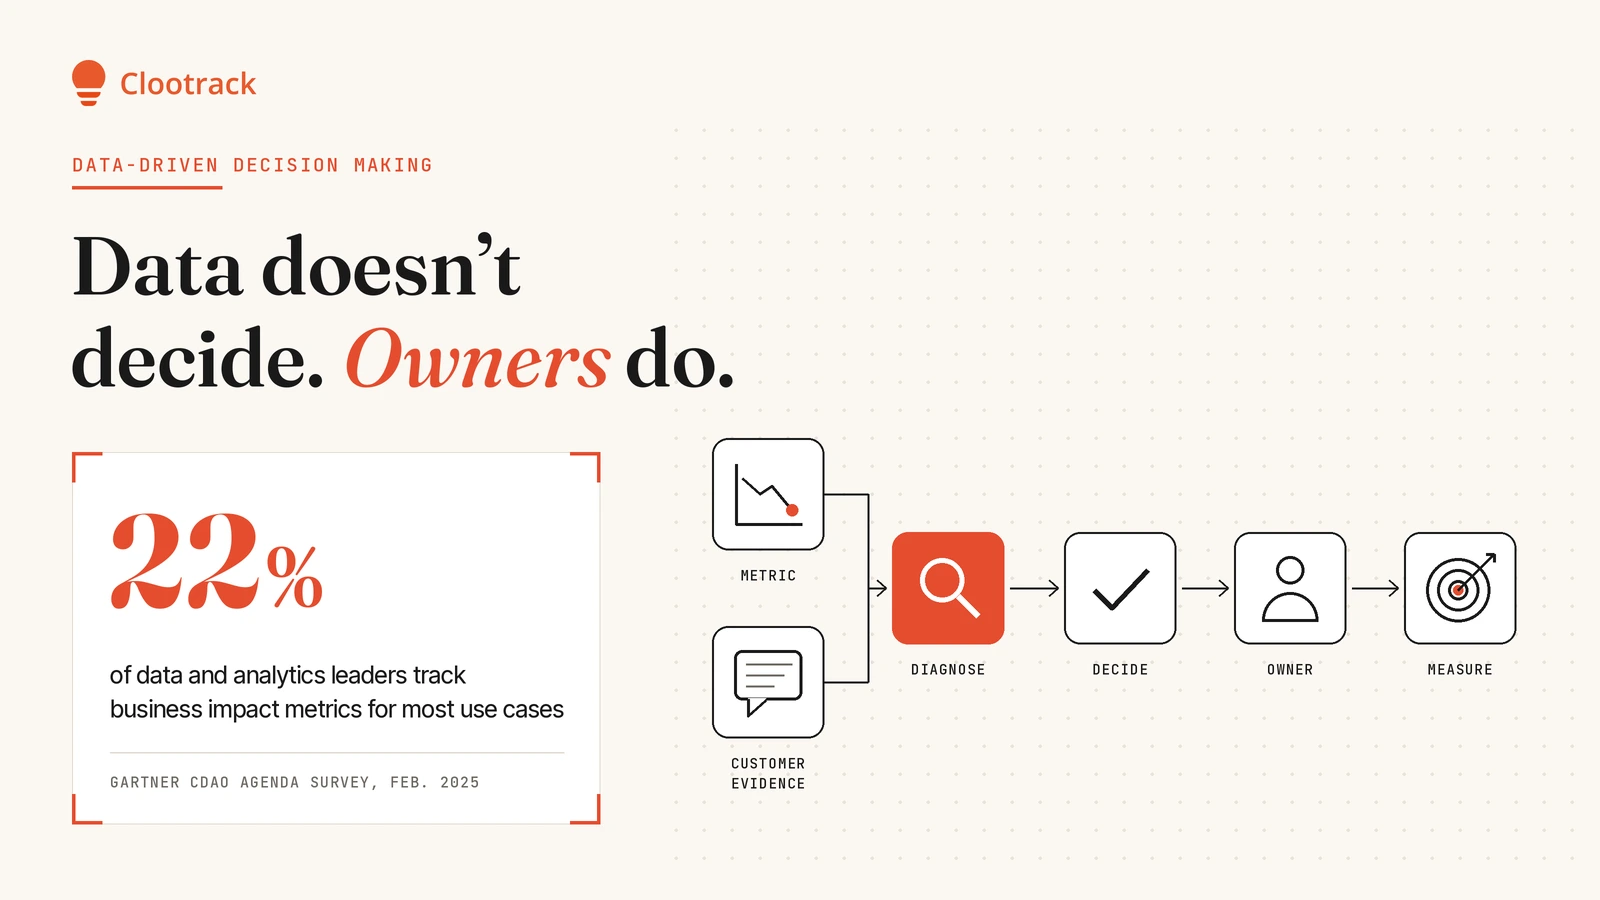
Organizations struggle because they measure analytics activity instead of decision impact, and because their data explains what happened without explaining why. Gartner's Chief Data and Analytics Officer Agenda Survey of 504 data and analytics leaders, fielded Sept. to Nov. 2024 and released Feb. 20, 2025, found that only 22% had defined, tracked, and communicated business impact metrics for most of their use cases.
A second gap separates individual benefit from enterprise results. In McKinsey's state of AI survey, published Aug. 25, 2026, from 1,719 respondents in 97 countries, 50% of respondents said AI helps them personally make better decisions. A different measure, the share of respondents attributing any EBIT impact at their organization to AI, stood at 37%. Better individual judgment is not yet compounding into financial outcomes.
Two causes explain most of that gap. First, decisions are rarely recorded with an owner and a KPI, so improvement cannot be attributed. Second, structured data describes the movement of a metric but not the customer behavior behind it. Our earlier analysis of how data connects to business outcomes traces the same break between reporting and action.
The four types are descriptive, diagnostic, predictive, and prescriptive analytics, and each answers a question a decision maker needs answered in order. The table follows one hypothetical scenario, created for illustration and not drawn from research: rising returns on a home goods brand's bestselling nonstick pan.
The diagnostic stage is the bridge between reporting and action, because it connects a change in business performance to the customer, operational, or market factors driving it. Without that connection, predictive models project the wrong problem forward and prescriptive models recommend the wrong intervention, such as discounting a product whose real issue is a care-instruction gap. For methods within each type, see Clootrack's guide to data analytics fundamentals.
Voice of Customer data supplies the diagnostic layer: customers' own explanations of their experiences, which transaction data alone cannot provide. Combined with operational and performance data, those explanations help leaders investigate why a metric moved and identify which drivers to test. That layer matters more as shopper behavior shifts. In Deloitte's 2026 Retail Industry Global Outlook, based on 330 retail executives surveyed Oct. 13 to Nov. 19, 2025, nearly seven in 10 agreed that trading down and value-channel shopping represent a structural change rather than a temporary reaction to inflation.
Price alone does not explain that shift. Deloitte's value-seeking consumer research, released June 24, 2025, and based on surveys of 9,000 U.S. consumers plus brand-level ratings data, found that between 10% and 40% of how consumers perceive a brand's value comes from factors other than price, such as quality and trust. A leader who answers value-seeking with price cuts alone is acting on an incomplete picture.
Customer conversations can also change which question a team asks in the first place.
Clootrack data: Alcohol intake was the largest spending-related theme in U.S. consumer conversations about GLP-1 medications, with 2,776 mentions and a 44.6% positive sentiment share. A smaller theme, alcohol sensitivity, skewed sharply negative at 14.4% positive across 160 mentions.
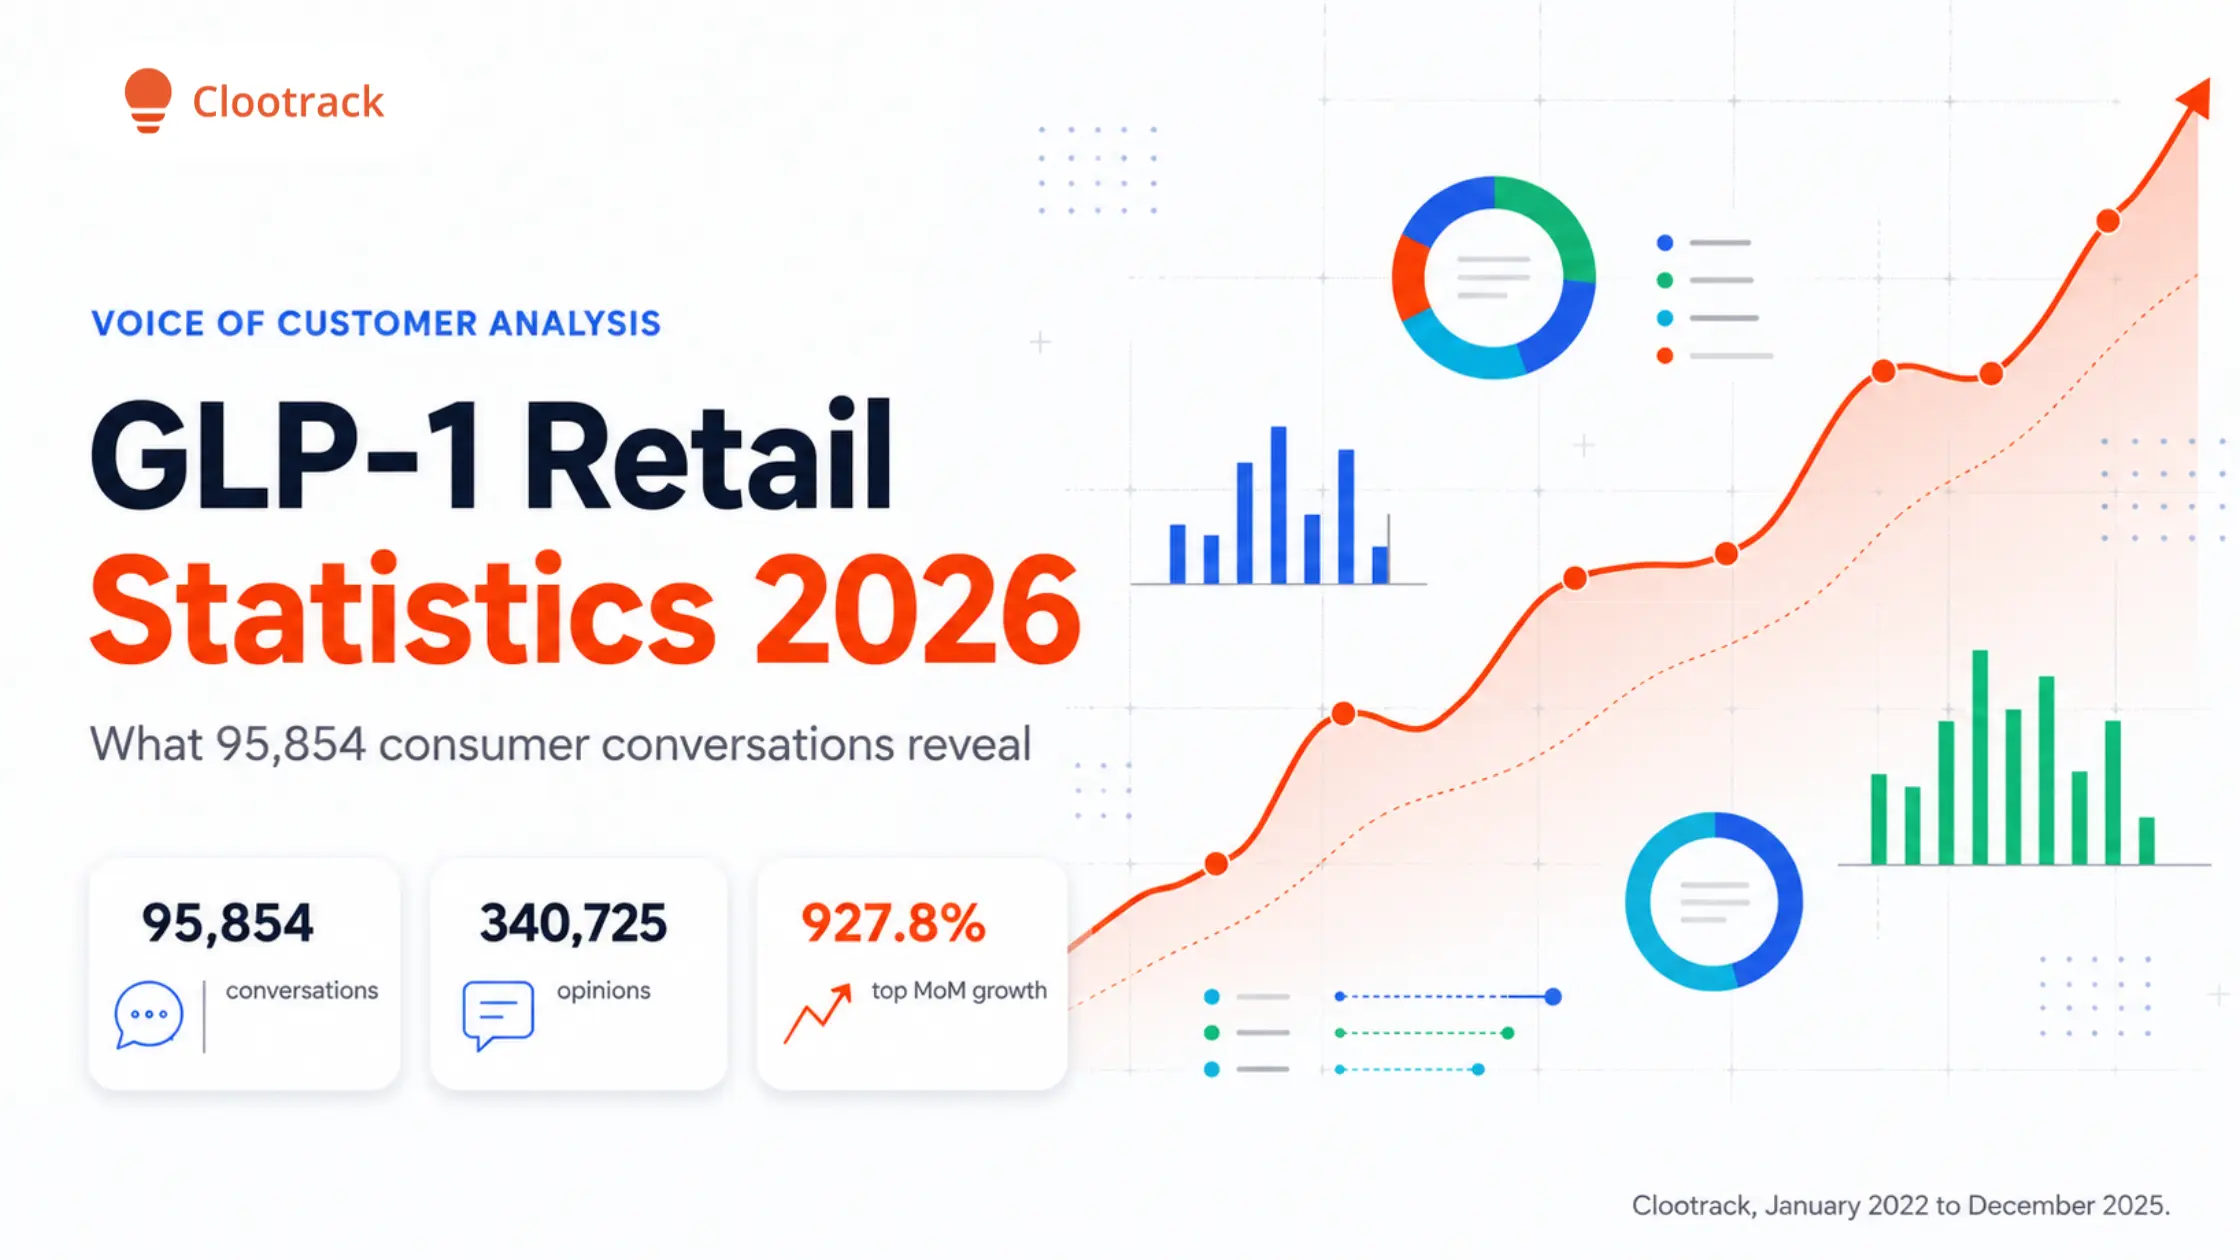
Sample basis: 95,854 conversations and 340,725 opinions from forums, social media, and health review sites, January 2022 to December 2025, analyzed at the opinion level.
Source: Clootrack GLP-1 retail research, June 2026. These are conversation signals, not sales figures.
Suppose a retailer's transaction data show declining beer and wine sales in its GLP-1 customer segment. A category manager might read the decline as price sensitivity and fund promotions. The conversation research surfaces another potential driver: consumers describing changes in their alcohol tolerance and sensitivity, which a discount may not address. That evidence creates a hypothesis to test against purchase data and a controlled promotion; it does not establish the cause of the sales decline.
Some of the richest diagnostic evidence already sits inside the company. Contact center conversation analytics surfaces problems before they reach ratings, while competitor reviews show whether a complaint is yours alone or category-wide. Running that comparison through competitive benchmarking tells leaders whether to fix a weakness or exploit a rival's.
Build it as five repeatable steps that begin with a decision rather than a dataset and end with a measured outcome.
Three operating principles keep the process durable under uncertainty. Decisions should be linked, so evidence flows across functions instead of stopping at departmental lines. They should be adaptable, with reversal triggers set in advance so a changed market prompts a planned response rather than a debate. And they should be continuous, reviewed on a fixed cadence rather than once a year at planning time.
Each leader should act on the part of the finding they control, because the same evidence implies different moves for product, merchandising, CX, and marketing. A single company-wide recommendation usually means no one owns it. The table applies a three-question decision lens (what is important, why it happened, what to do next) to the hypothetical nonstick pan scenario.
The credibility of this lens comes from combining evidence types. Returns data alone would point to the product team, and reviews alone would point to quality. Combining returns, reviews, contact center transcripts, product page content, and assortment data can reveal how different functions contribute to the problem and where accountability for the fix belongs.
The most damaging mistakes are organizational rather than technical: unclear ownership, evidence no one trusts, and teams that treat data as a veto rather than an input. In a Gartner survey of 223 data and analytics leaders conducted in March 2026 and released Sept. 21, 2026, 60% cited cultural resistance as a key reason governance programs fail, compared with 40% who cited funding constraints.
AI agents will move data-driven decision making from reports people read to systems that recommend and sometimes execute actions, which raises the bar for evidence quality and governance. Deloitte's 2026 retail outlook found that 68% of retail executives expect to deploy agentic AI for key operational and enterprise activities within 12 to 24 months, while 44% say legacy systems are already slowing innovation. Both figures are executive expectations, not measured outcomes.
The same Deloitte survey of retail executives found that 81% believe generative AI will weaken brand loyalty by 2027, as AI shopping assistants weigh value and fit over brand recognition. If that expectation holds, brands will compete on how quickly their decisions respond to what customers say about quality, fit, and service.
Three governance requirements follow for any organization letting agents work with business evidence:
The test of a data-driven organization is not how much data it holds or how many dashboards and agents it runs. It is whether every consequential decision has a named owner, a stated hypothesis, and a result someone checks. Leaders who hold decisions to that standard can show their boards which calls moved margin, retention, or customer experience and which did not, and that record is what justifies the next investment.
Data-driven decision making lets evidence determine the choice once the decision and success criteria are set. Data-informed decision making treats evidence as one input alongside judgment, strategy, and values. Most effective organizations are data-driven on operational calls such as replenishment and routing, and data-informed on strategic calls such as market entry, where history is a weaker guide.
Common examples include delisting SKUs whose reviews show persistent quality complaints, reallocating inventory by region based on demand and return patterns, rewriting product pages that generate avoidable support calls, and adjusting private-label pricing after comparing customer sentiment on value against competing brands. Each decision pairs a performance metric with customer-stated reasons.
Record the KPI baseline and target before acting, then compare results after a defined period against that baseline and, where possible, against a control group or matched prior period. Track a leading indicator, such as complaint volume, alongside the lagging outcome, such as margin, so you can judge early whether the decision is working.
Yes. Small teams can start with one recurring decision, a shared decision log, and two evidence sources: a performance metric and themed customer feedback. AI-powered feedback analysis now handles theme detection and sentiment that once required specialist analysts, which lets category and CX managers diagnose drivers themselves and reserve data science for modeling.
Unstructured feedback becomes decision-ready when AI groups comments into themes, scores sentiment for each theme, tracks volume and trend over time, and tests themes against KPIs such as returns, ratings, or churn. Unsupervised theme discovery matters because it surfaces issues no one thought to ask about in a survey.
Yes, when it is used to form hypotheses and to decide where evidence is thin. Experienced leaders spot anomalies faster than dashboards do. The discipline is to treat intuition as a question to test rather than an answer to defend, and to record when judgment overrode evidence so the organization can learn from the outcome.
Share :


Analyze customer reviews and automate market research with the fastest AI-powered customer intelligence tool.