🎉 Clootrack recognized by OpenAI for crossing 100 billion tokens in Voice of the Customer analytics →
Read the story
The global cocoa and chocolate market was worth USD 46.61 Billion in the year 2021 and is projected to grow from USD 48.29 Billion in 2022 to USD 67.88 in 2029 with a CAGR of 4.98%. And, the US chocolate market is projected to witness a CAGR of 4% during 2022 - 2027.
The analysis is based on customer reviews and conversations online in the segment. The analysis results presented are completely unbiased and not based on any subjective judgment. The source data used for the analysis are user conversations available publicly online like public forums and social media.
Studies reveal that there will be 275.03 Million chocolate consumers in the US by 2024. Since no one gets bored of chocolates, this industry will remain a high-demand food product forever.
Provided, chocolate brands keep an eye on their customer expectations since a small mistake in any part of the customer touchpoints can go lead to the downfall of a brand. These perfect snacking and gifting chocolates sometimes fail to meet the customer's expectations, even though the brands give their best.
As we move into the post-pandemic era, brands need to consider a different approach to customer experience due to changes in customer demands.
While chocolate brands are trying to offer happiness, a single unexpected negative micro-moment can cause customers to feel unhappy about the whole experience.
Customer experience represents every touchpoint with a brand, including accessing them via physical stores, online shops, customer support, and direct product interaction.
So, how can you create the best customer journey for your chocolate customers?
Let's check the demand drivers and aspects that break the customer experience in the chocolate industry.
There could be 100 reasons why your customers are buying from you!! And these reasons are entirely based on the experience the customers have during the entire buying process.
When you identify and understand what your customers love about your brand, then you know what to overcome and what to master in the entire customer journey.
To attract new customers and keep the regular customers satisfied, brands need to look into the top drivers that trigger customers to like a chocolate brand.
Clootrack has listed the top 5 category drivers in the chocolate category based on 12,964 customer reviews and ratings they submitted on various websites.
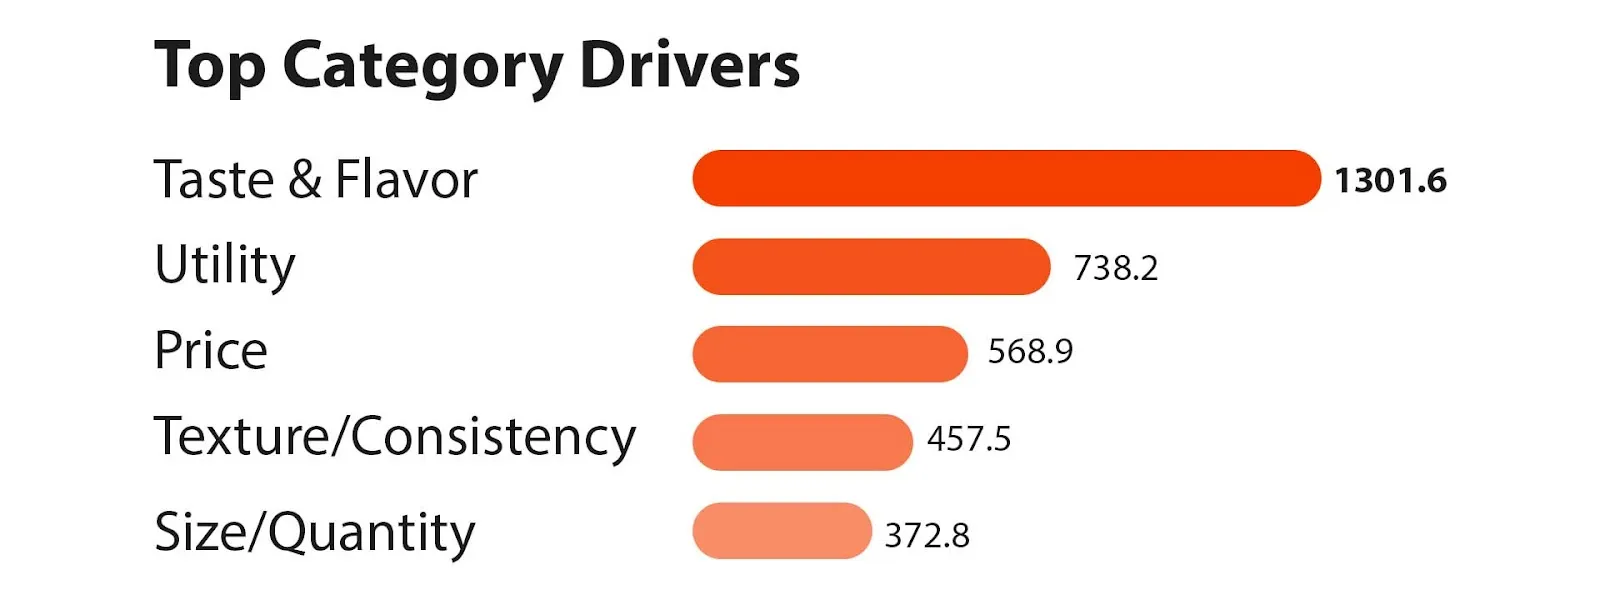
The interesting part is that these top drivers remained the same across all chocolate categories such as the Dark Chocolate, Milk Chocolate, and White Chocolate.
Being the primary driver, it holds the first preference in the customer experience of chocolates. Chocolate is all about the taste and flavor that customers are looking for. If they find chocolate that tastes good and has a flavor that satisfies their palate, they will buy more.
“For the candy bar originally known as "Forever Yours", it still tastes like it did when I was a kid!”
“Awesome treat, great tasty Peanut Brownie , taste a lot of chocolate and peanuts, wished I tasted more brownie but still an excellent and new twist on the brand.”
Utility refers to the gifting ability or a purpose here. Chocolate has been a perfect gifting option since decades ago, and many customers use fruity and nutty rich chocolates as a snack or even for lunch. So, if customers find chocolate as a perfect gift, snack, treating, serving as desserts at parties, etc., they will prefer it more than other chocolates.
“This is one of my favorite treats I like to get around the holidays. Anything in this brand is amazing, but the peppermint bark is hands down my favorite”
“these are delicious, fresh and very giftable, as they are beautifully and individually wrapped! I highly recommend without hesitation!”
The Price comes as the third driver. Customers are also concerned about the price of products, and they expect a level of quality based on the money they spent on chocolate. Customers are ready to spend more on quality and premium chocolates and when it comes to premium chocolates, they are not much concerned about the size and quantity of chocolates.
“it's so delicious, creamy and smooth, melts in your mouth, and i've found that it's pretty much always much less expensive than the higher end brands like lindt, but still tastes and feels just as decadent!”
“was so happy to find these at amazon ordered them enjoyed them very much will order again wonderful flavor value for the money makes a great gift for those who remember this candy bar growing up.”
Customers like chocolates that have a rich, creamy, and smooth texture. Customers also like caramel, crunchy and fruity, and nutty texture in the chocolates. They are not much concerned about the texture and consistency in expensive premium chocolates.
“I really like the bars. The wafer inside gives it a crispy crunch along with a great chocolate coating that is creamy and smooth.”
“this milk chocolate was so smooth and creamy, this is like royalty of milk chocolate lol.”
Customers expect a product in a size that they saw in the pictures in commercials and online stores. Customers are more concerned about this in the less priced products. Relatively in high-priced chocolates, customers do not pay much attention to the size and quantity.
“the mini size is absolutely perfect to take care of that chocolate and/or caramel craving without going overboard - as long as you can limit yourself to one ... or two ... at a time.”
“these are the perfect size to use as a reward for my class, allowing the kids to have a treat and not ruin their dinner.”
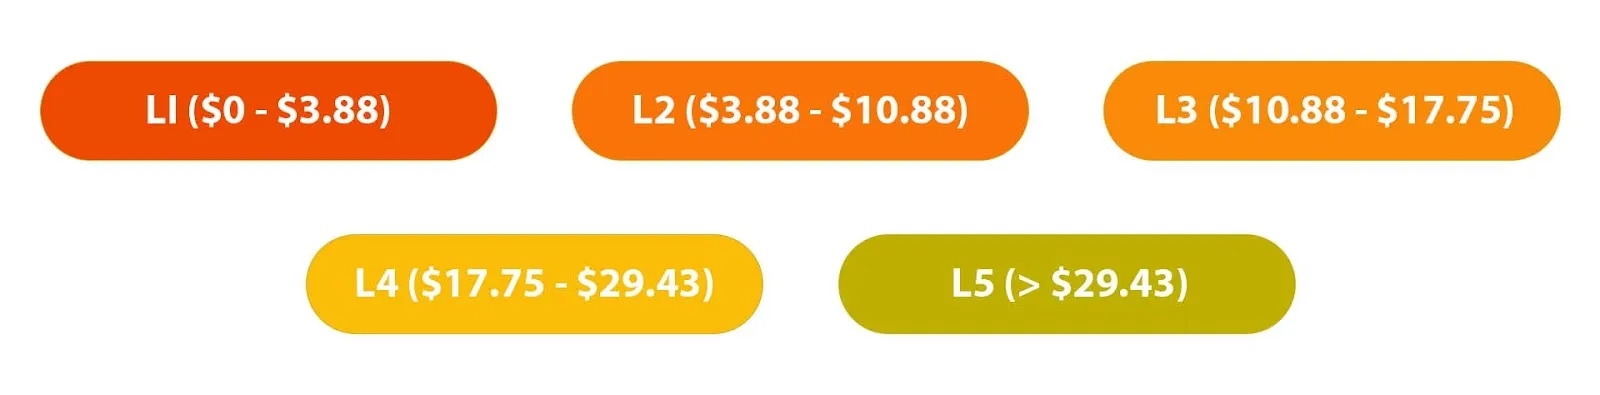
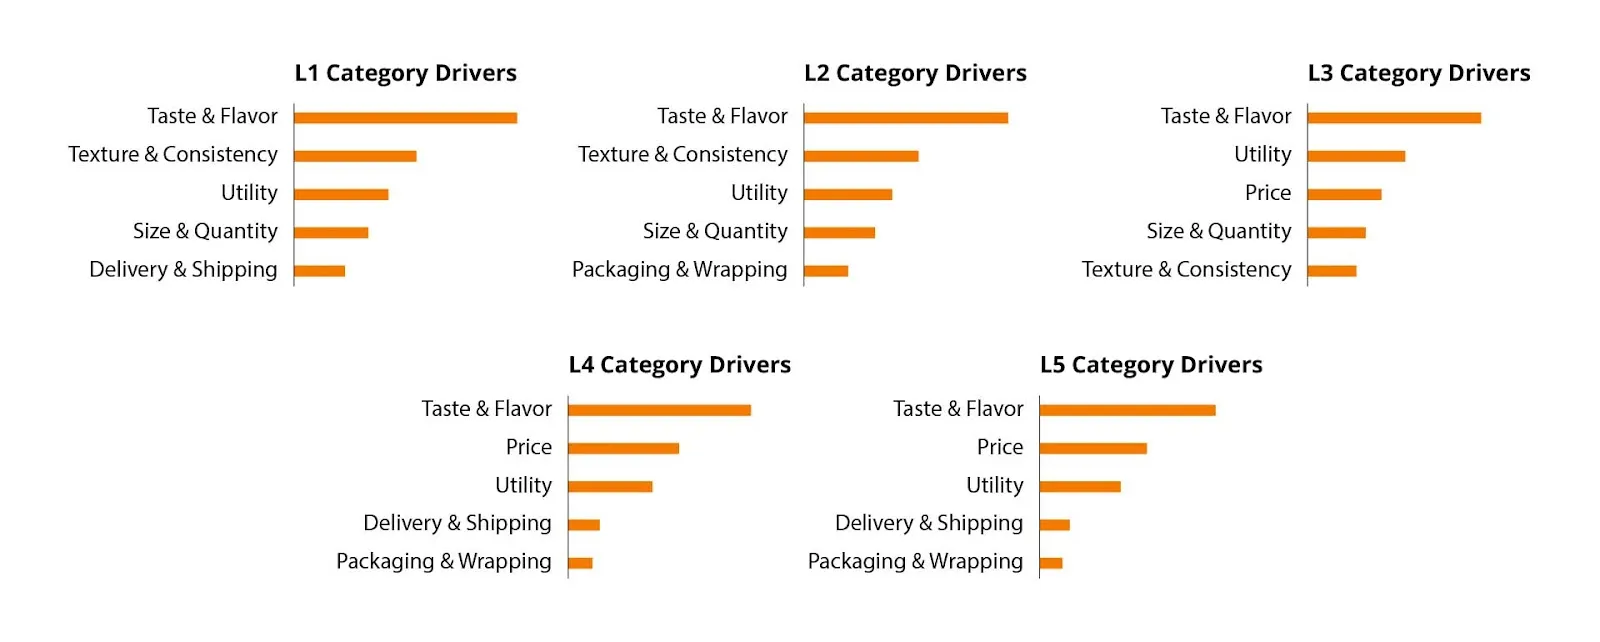
When Clootrack checked these category drivers against different price bands ranging from $0 - $3.88 to >$29.43, Taste and Flavor are the first priority of customers no matter what is the price of the product.
Taste and Flavor is the topmost driver in this price band. Taste and Flavor is followed by Texture & Consistency, Utility, Size & Quantity and Delivery & Shipping. It seems that Price and Packaging & Wrapping are not important factors in low price bands.
In this price band also, Taste & Flavor is the leading driver, and it is followed by Texture & Consistency, Utility, Size & Quantity, and Packaging and Wrapping. Here, compared to L1, Delivery & Shipping is not the main theme, instead, Packaging & Wrapping has importance.
Unlike L1 and L2, the priority of Utility has risen to the second position in L3. Then, Price has become a concern of customers and it holds the 3rd position. Texture & Consistency has become the least important in this price band as it holds the 5th position.
Both L4 and L5 seem identical as we can see the same top drivers in the same order in both bands. After Taste & Flavor, Price has become the next priority of customers in these price bands. Like L1 & L2, Utility has become the 3rd priority. Delivery & Shipping and Packaging & Wrapping drivers hold the 4th and 5th positions respectively. Customers are not at all concerned about the Texture & Consistency of these bands.
To find the top themes that contribute to high positivity in the customer experience of chocolates, we have taken themes that gathered more than 75% positive customer reviews.
There are 3 themes that gathered more than 75% positivity. They are:
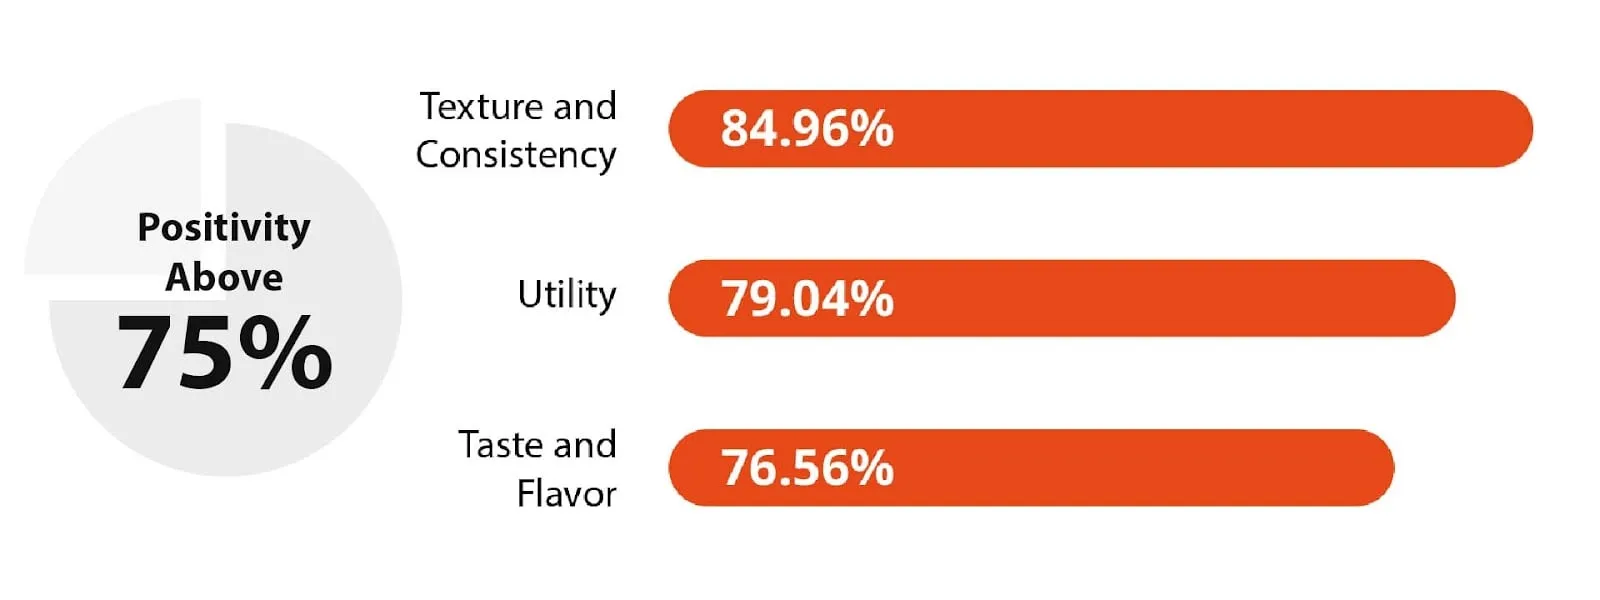
84.96% of customers liked the chocolate they bought since it had great texture and consistency.
When we dig deep into their subthemes,
Customers like the Utility of chocolate because:
Taste & Flavor makes customers happy because:
As we see the below charts, it is clear that there is a steep decline in the positivity toward Utility, Texture and Consistency, and Taste and Flavor in December 2021.
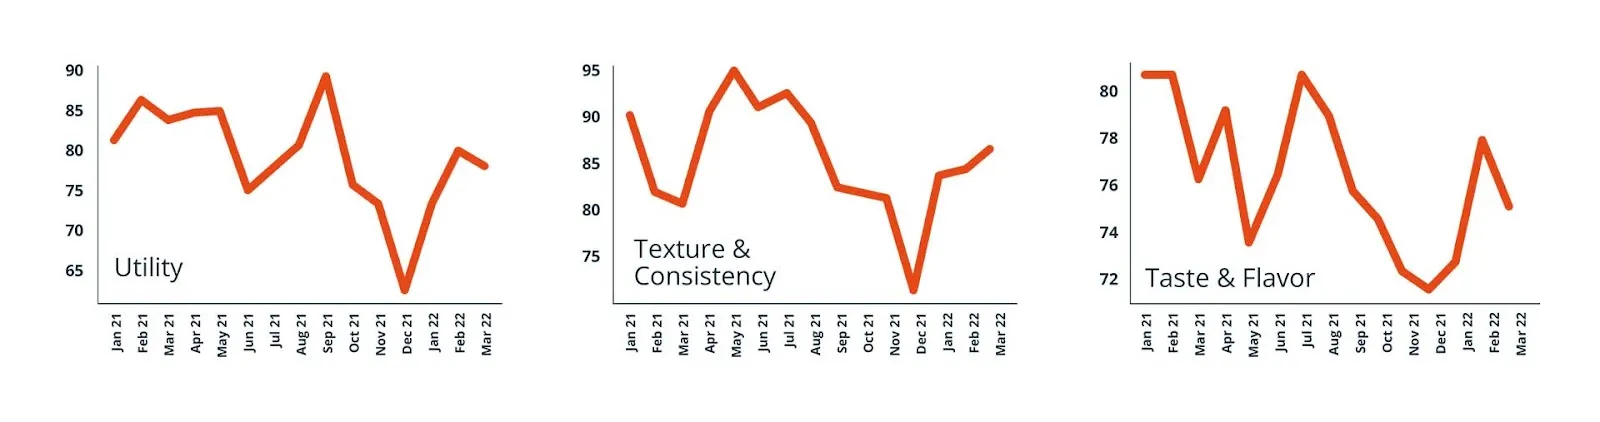
Since these 3 aspects are the most critical drivers in the chocolate industry, brands cannot compromise on these.
The reason for this dip can vary. They can be:
To find the top factors that contribute to high negativity in the customer experience in the chocolate industry, we took aspects that gathered more than 25% negativity.
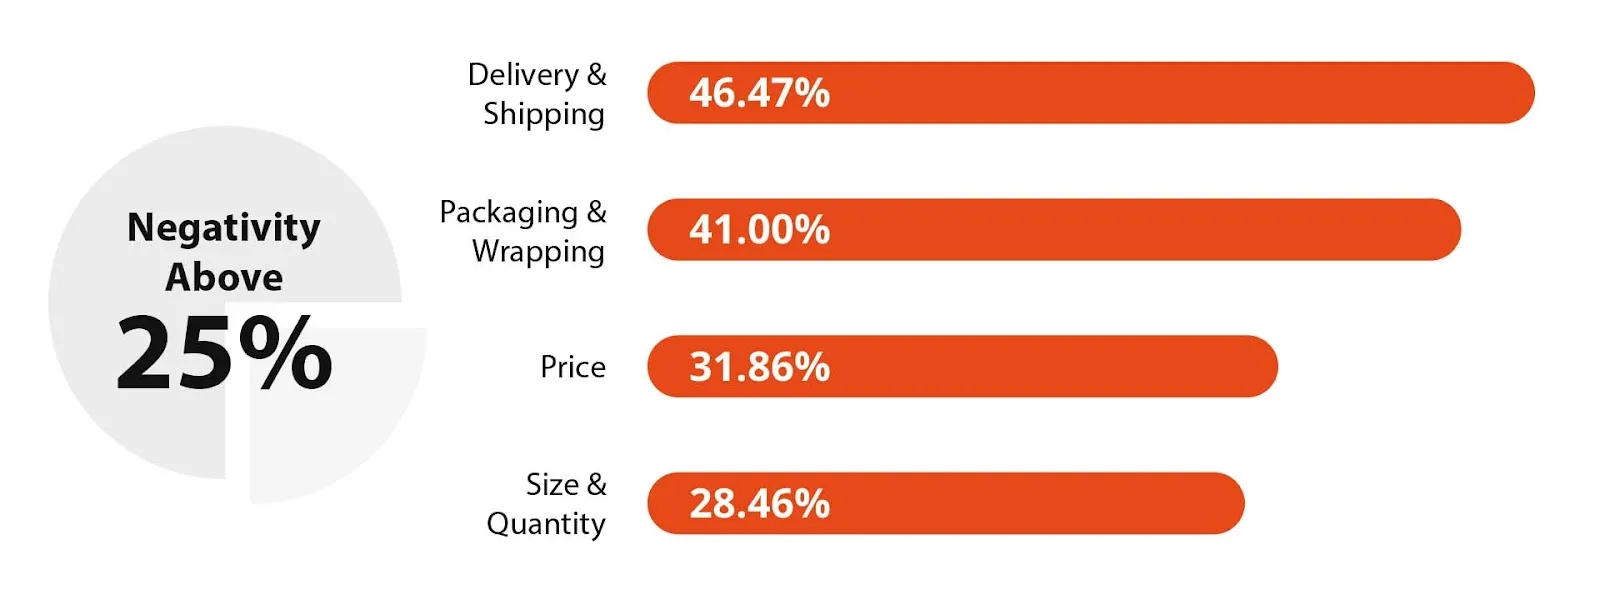
Delivery and Shipping, Packaging and Wrapping, Price, and Size and Quantity have gathered more negative attention from customers.
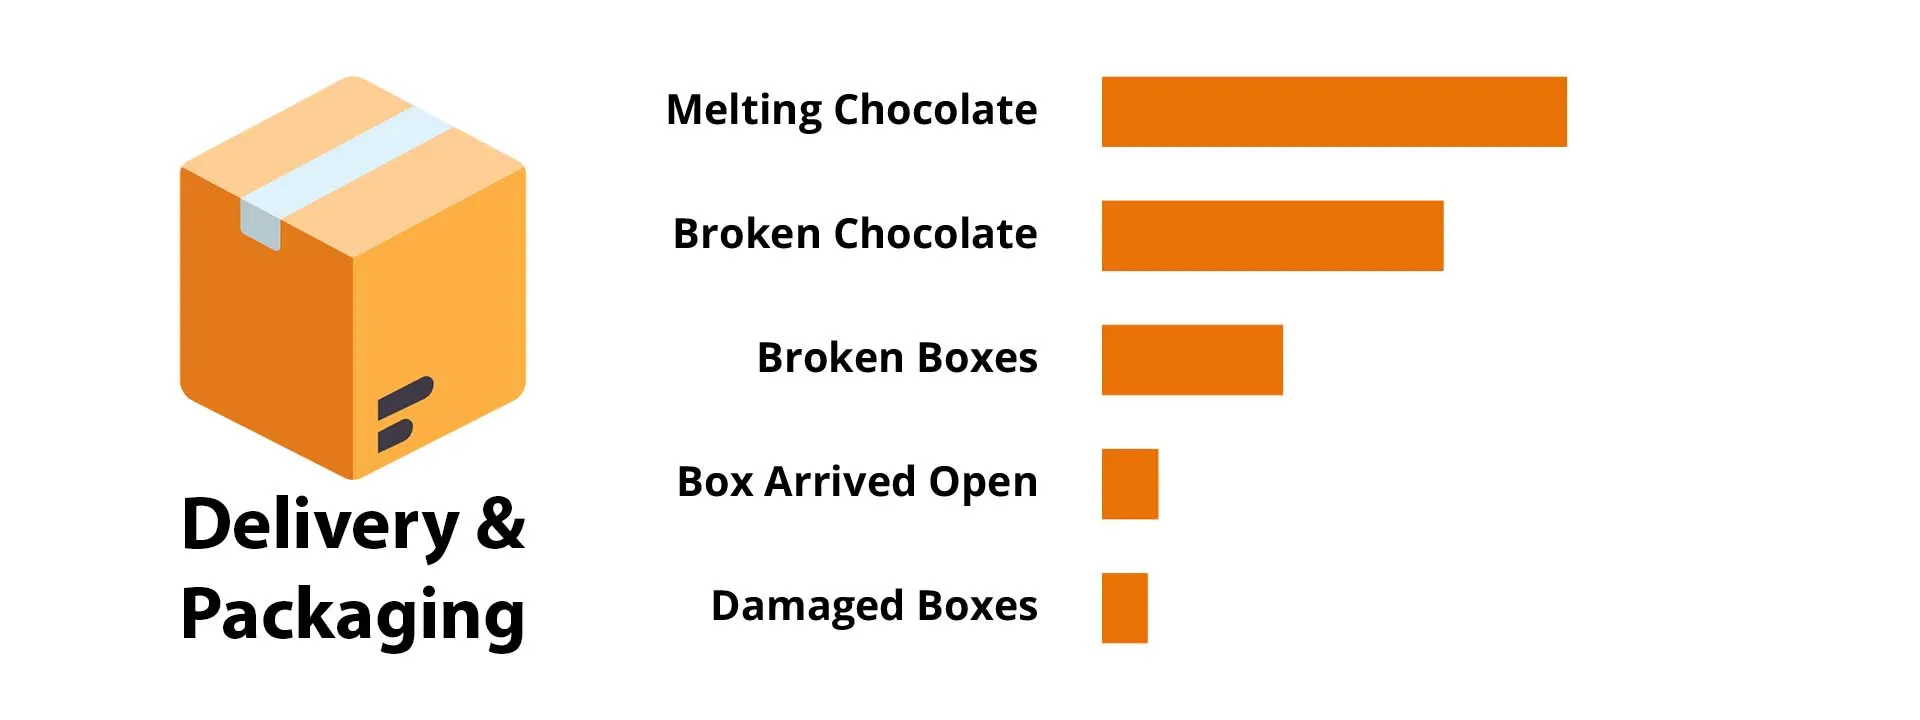
1. Delivery and Shipping gathered more negative reviews which are close to 50%. When we dig deeper to find what subthemes contribute to this positivity, it’s found that,
It is clear that this can happen due to the improper shipping and delivery of chocolates by the shipping companies and delivery partners. Chocolates are delicate and fragile, they need to ship properly in iceboxes and deliver properly.
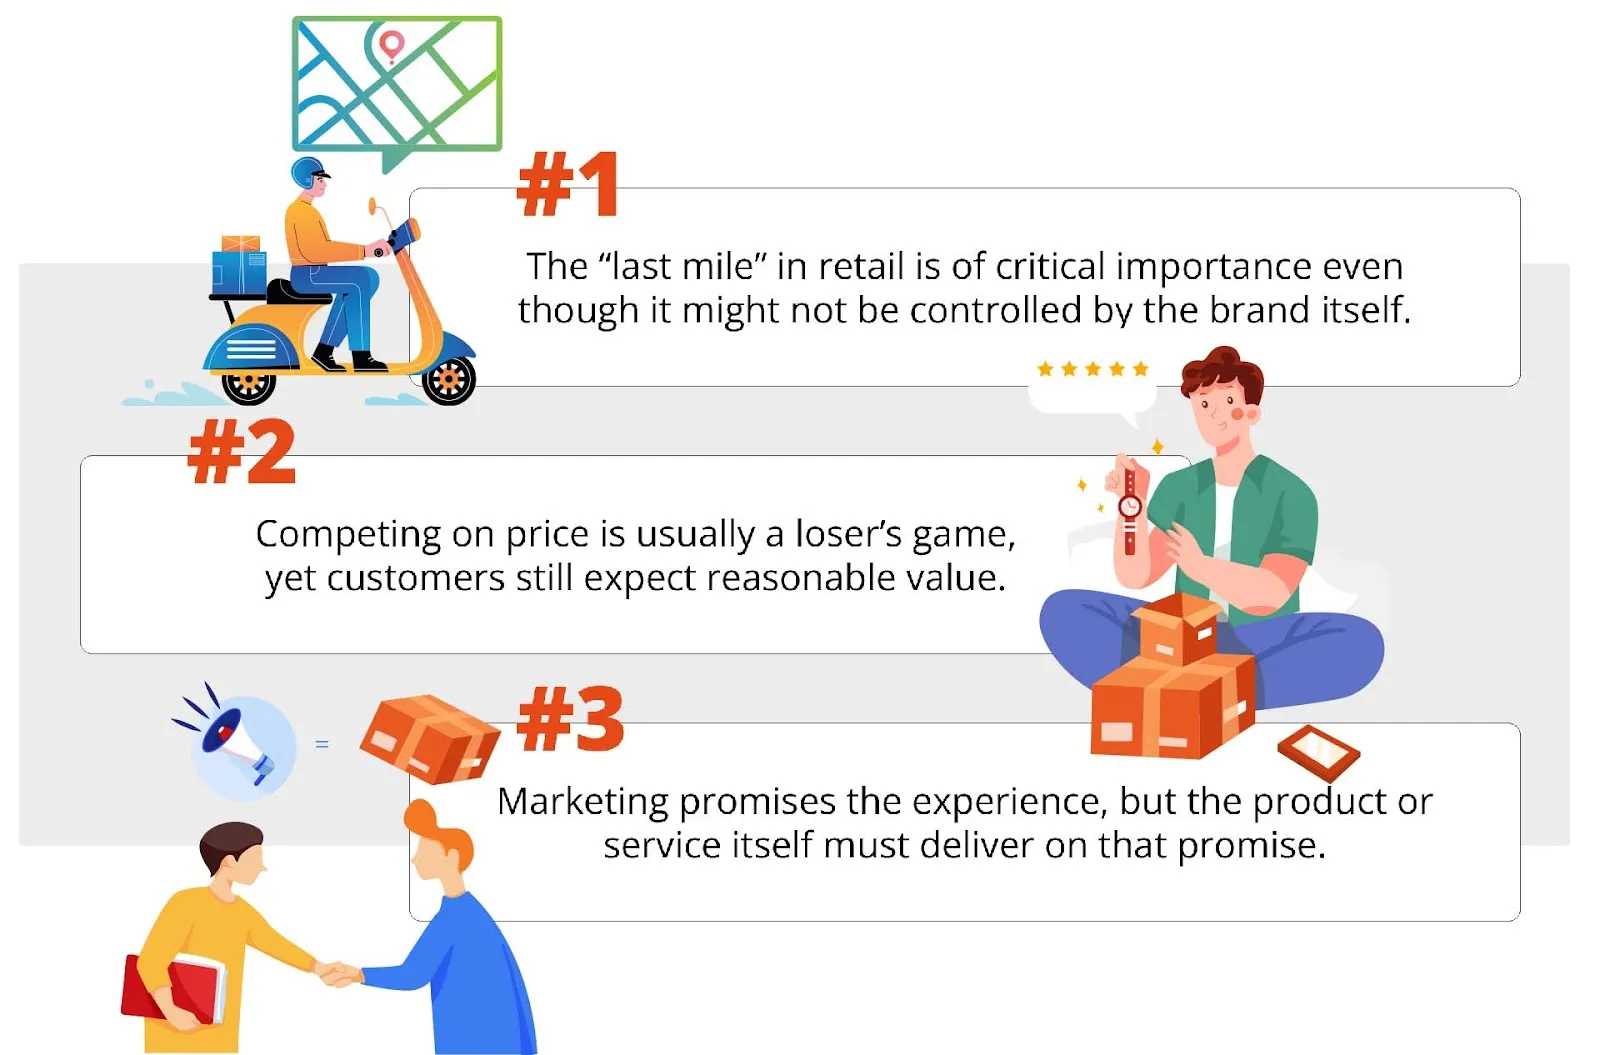
The interesting part here is that these things are not in the hands of the brand. But still, these factors contribute to the highest negative experience.
“sent this as a gift to my son in law only to arrive totally melted, including the cold pack that was included with the candy, I am insulted that better precautions were not taken to ensure the item arrived intact for the person getting it as well as the person who paid for it”
“Obviously, i wouldn’t order this in the summer or anything like that because they will melt and you’ll have wasted your money.”
“unfortunately item was received broken in pieces due to soft mailer bag and item expired the day i received it.”
2. Packaging & Wrapping has gathered 41% negative reviews, which is relatively high. When we dig deep to find the reason for this much negative feedback, it is found that,
Brands can work around this and ensure they pack it properly in tight boxes. If this happens during shipping, it’s better if brands photograph and send the images of packaged goods to customers even before they ship them. Also, choose delivery partners who mainly ship food products and offer quality services.
“upon receiving my order of two boxes a day late, i opened the package and was horrified to find that it was shipped with only normal "packing balloons," in the summer sun at the height of a heatwave.”
“candy bar box arrived with smashed corners and looked like it had been thrown around the warehouse a few times.”
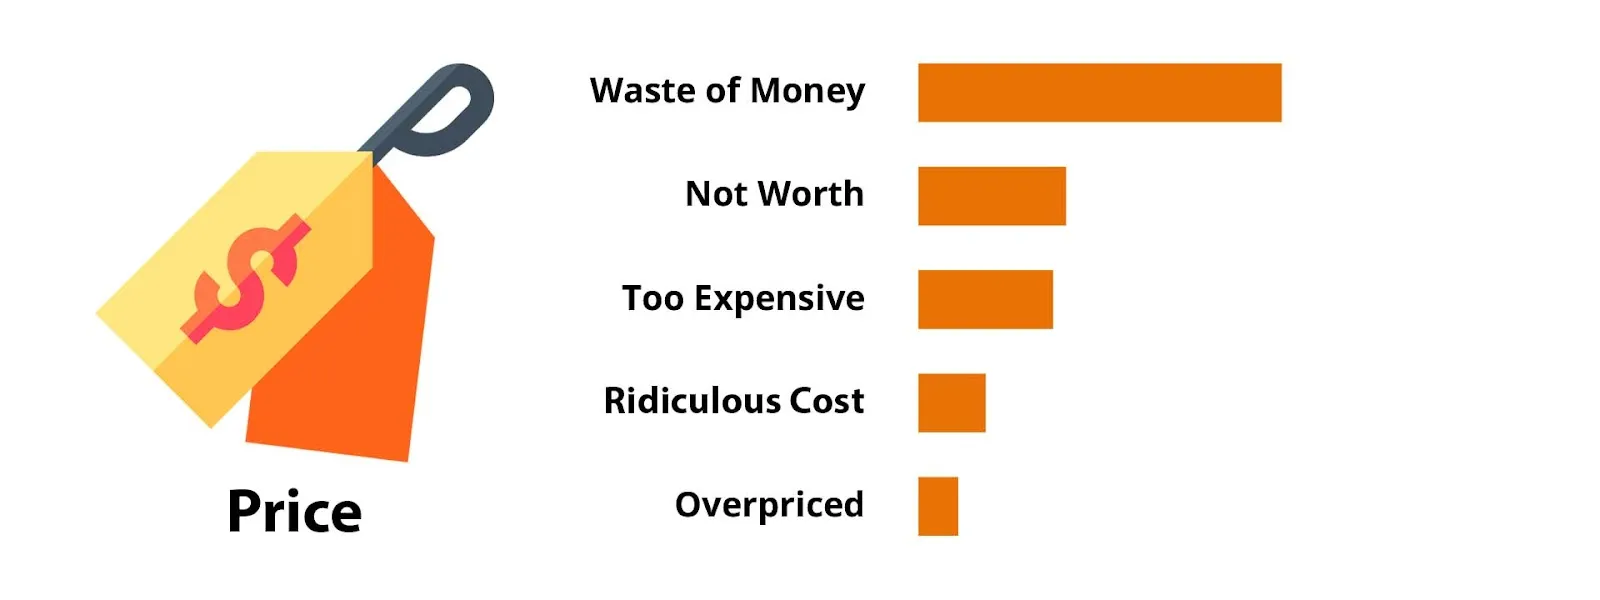
3. Price has gathered 31.86% negative customer reviews. As it is Price, the issues will be mainly around the overpricing or the Price not justifying the poor quality of products delivered by brands.
“i assumed it was the big bag since it was so expensive, but unfortunately my assumption was wrong and it’s just the standard smaller bag with about 18/20 chocolates.”
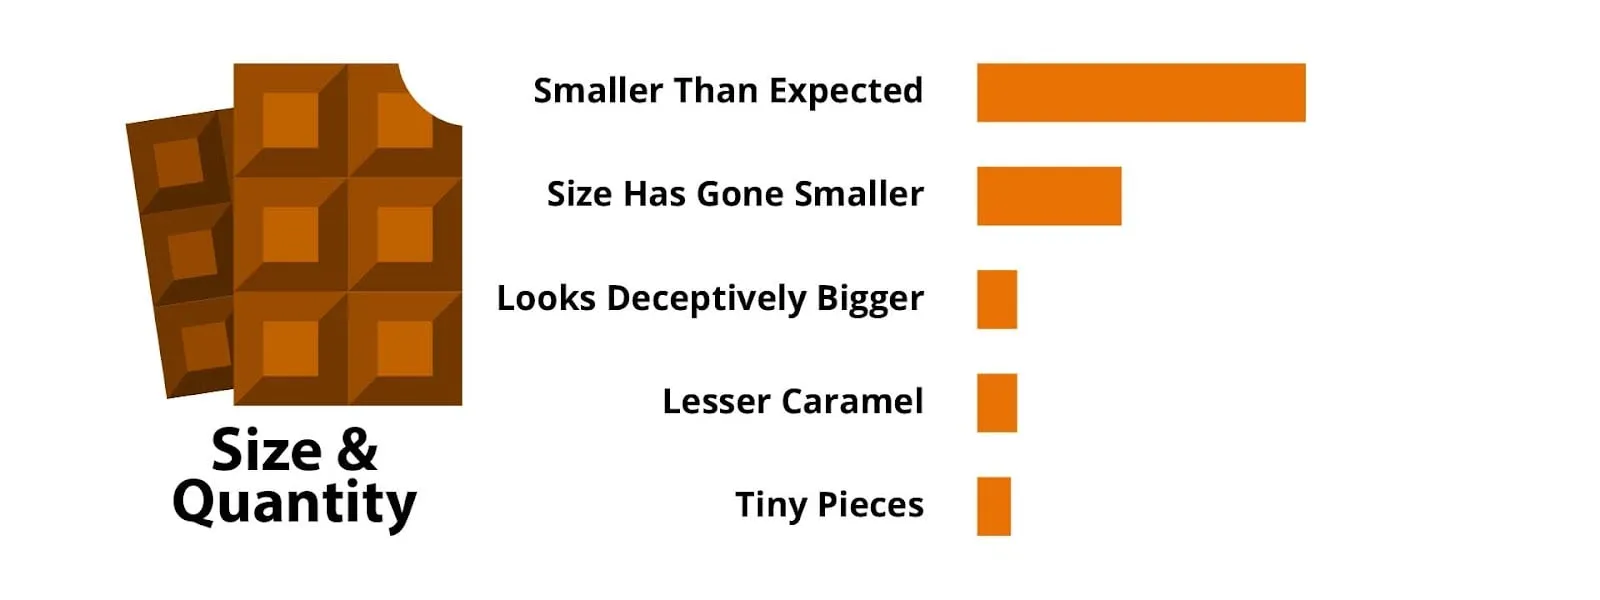
4. Size & Quantity has attracted 28.46% negativity in customer reviews. Misleading with the pictures shown in the online stores is the main reason for this negativity. When we dig deep into this, we found that,
“the pieces of foil were so small, i could barely even see it, so i really hope people haven't been eating these without noticing.i contacted amazon and they said they couldn't return the reese's because it's food, so i had to just throw the entire bag away.”
We have taken the 4 negative contributing themes and checked the trend of their increasing negativity.
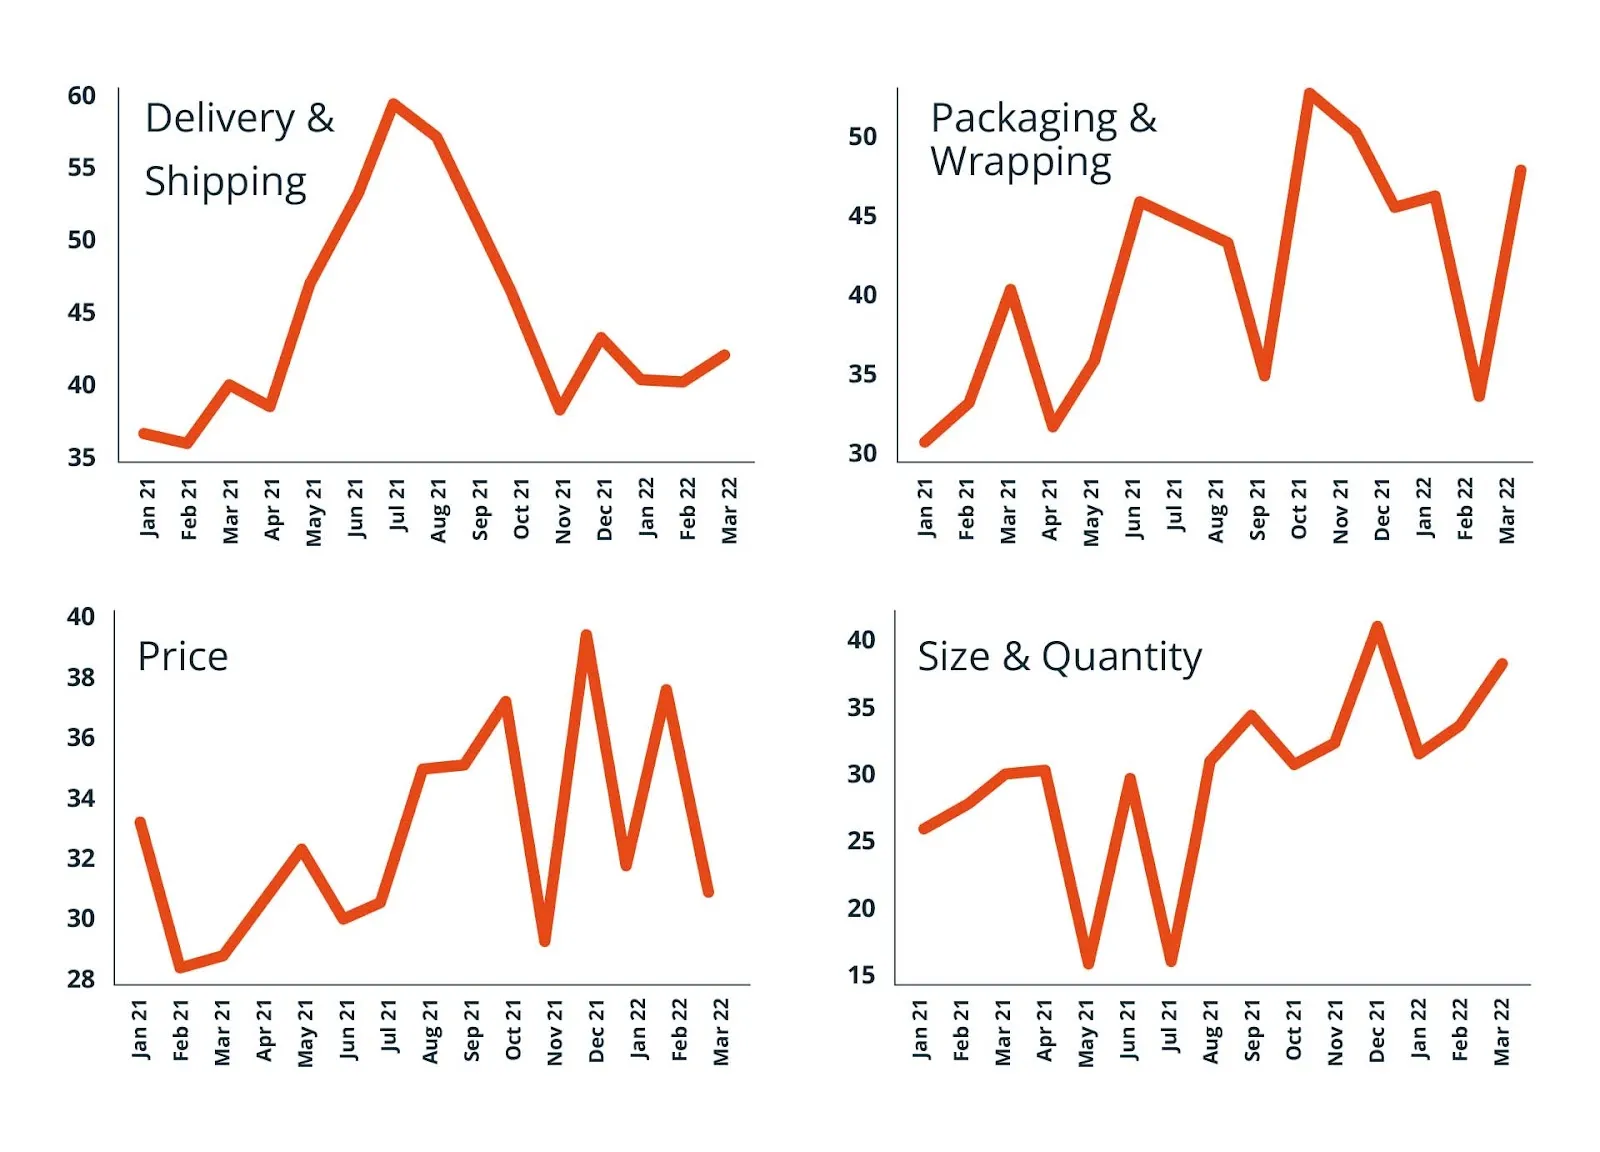
Apparently, Size and Quantity has attracted more negativity from August 2021 to March 2022.
The reason for this higher negativity is that 60% of customers felt the chocolate is smaller than they expected.
They might be misled by the picture they saw in the online store. It might seem bigger in pictures, but when they received it, they found it was much smaller than expected.
Products melted, crushed, and broken are the concerns that increase the negativity towards Delivery & Shipping. Customers even feel that the packages are thrown in the warehouses multiple times. So brands need to choose the proper shipping and delivery partners and make sure the products are received on time because there are customers who received products after their expiry date!
Customers reported the boxes seemed crushed; they were open and not packed adequately in iceboxes. Most of them received melted and broken chocolates due to improper packaging.
Customers raised their dissatisfaction with the money they spent on small-sized products. Unexpected product size is the main reason for this negativity around Price. And customers reported that some brands compromise on the quality of chocolates to make them cheaper.
To gain more positive impressions from customers, chocolate brands need to focus on delivering the chocolates to the proper hands. Also, tight and safe packaging has a major role in delivering the chocolates intact.
Since customers are frustrated with melted and broken chocolates and damaged boxes, brands really need to find immediate solutions to solve these.
Customers won’t complain about reasonable prices when they get an expected quality of chocolate. But, when they pay a higher price for a premium or hand-crafted chocolate, they want that chocolate to be of a higher level of quality.
When that doesn’t happen, they feel it is a waste of money, not worth, expensive, overpriced, etc. To avoid such kinds of complaints, brands need to price a product as per the quality they promised to offer.
When a brand markets its products, it should be careful about delivering the exact product they market and promising. When the customers see the product is different from what you marketed, they will get frustrated.
Many customer complaints are gathered around Size and Quality are - the products are smaller than expected, misleading size in pictures, less caramel, small pieces, etc.
There is no doubt that Taste and Flavor would be the topmost category driver in the chocolate industry since people consume them to satisfy their cravings and taste buds. Other factors like giftability, price, texture, and consistency come secondary.
But when it comes to buying products online, there are some other concerns of customers that can lead the customer's experience down. Even though chocolate is perfect in its taste, texture, and packing, things may go wrong.
Shipping and delivery of chocolate products play an important role in the overall customer experience. Even though customers love chocolate, they may get dissatisfied if they receive it melted or broken.
Often, these uncontrollable factors can also put a brand’s experience in danger. So brands need to find a proper solution and precautions to avoid these uncontrollable factors.
To know more about the consumer insights derived from chocolate customers, you can download the PDF version of the report for free. Enter your email at the end of this report, and we’ll send it to you for FREE.